AppLovin spent over a decade as a mobile gaming ad network before ecommerce brands started paying attention.
That shifted fast. The platform's video-first inventory and audience reach became hard to ignore, and by 2025 it had become one of the most-discussed performance channels in DTC. The problem: That momentum hasn't been tested across all channels equally.
We examined 12 months of data acros 755 shops, so we checked, using attribution, marketing mix modeling (MMM), and real geo holdout tests, whether AppLovin is actually driving revenue, or just claiming credit for it.
Key takeaways
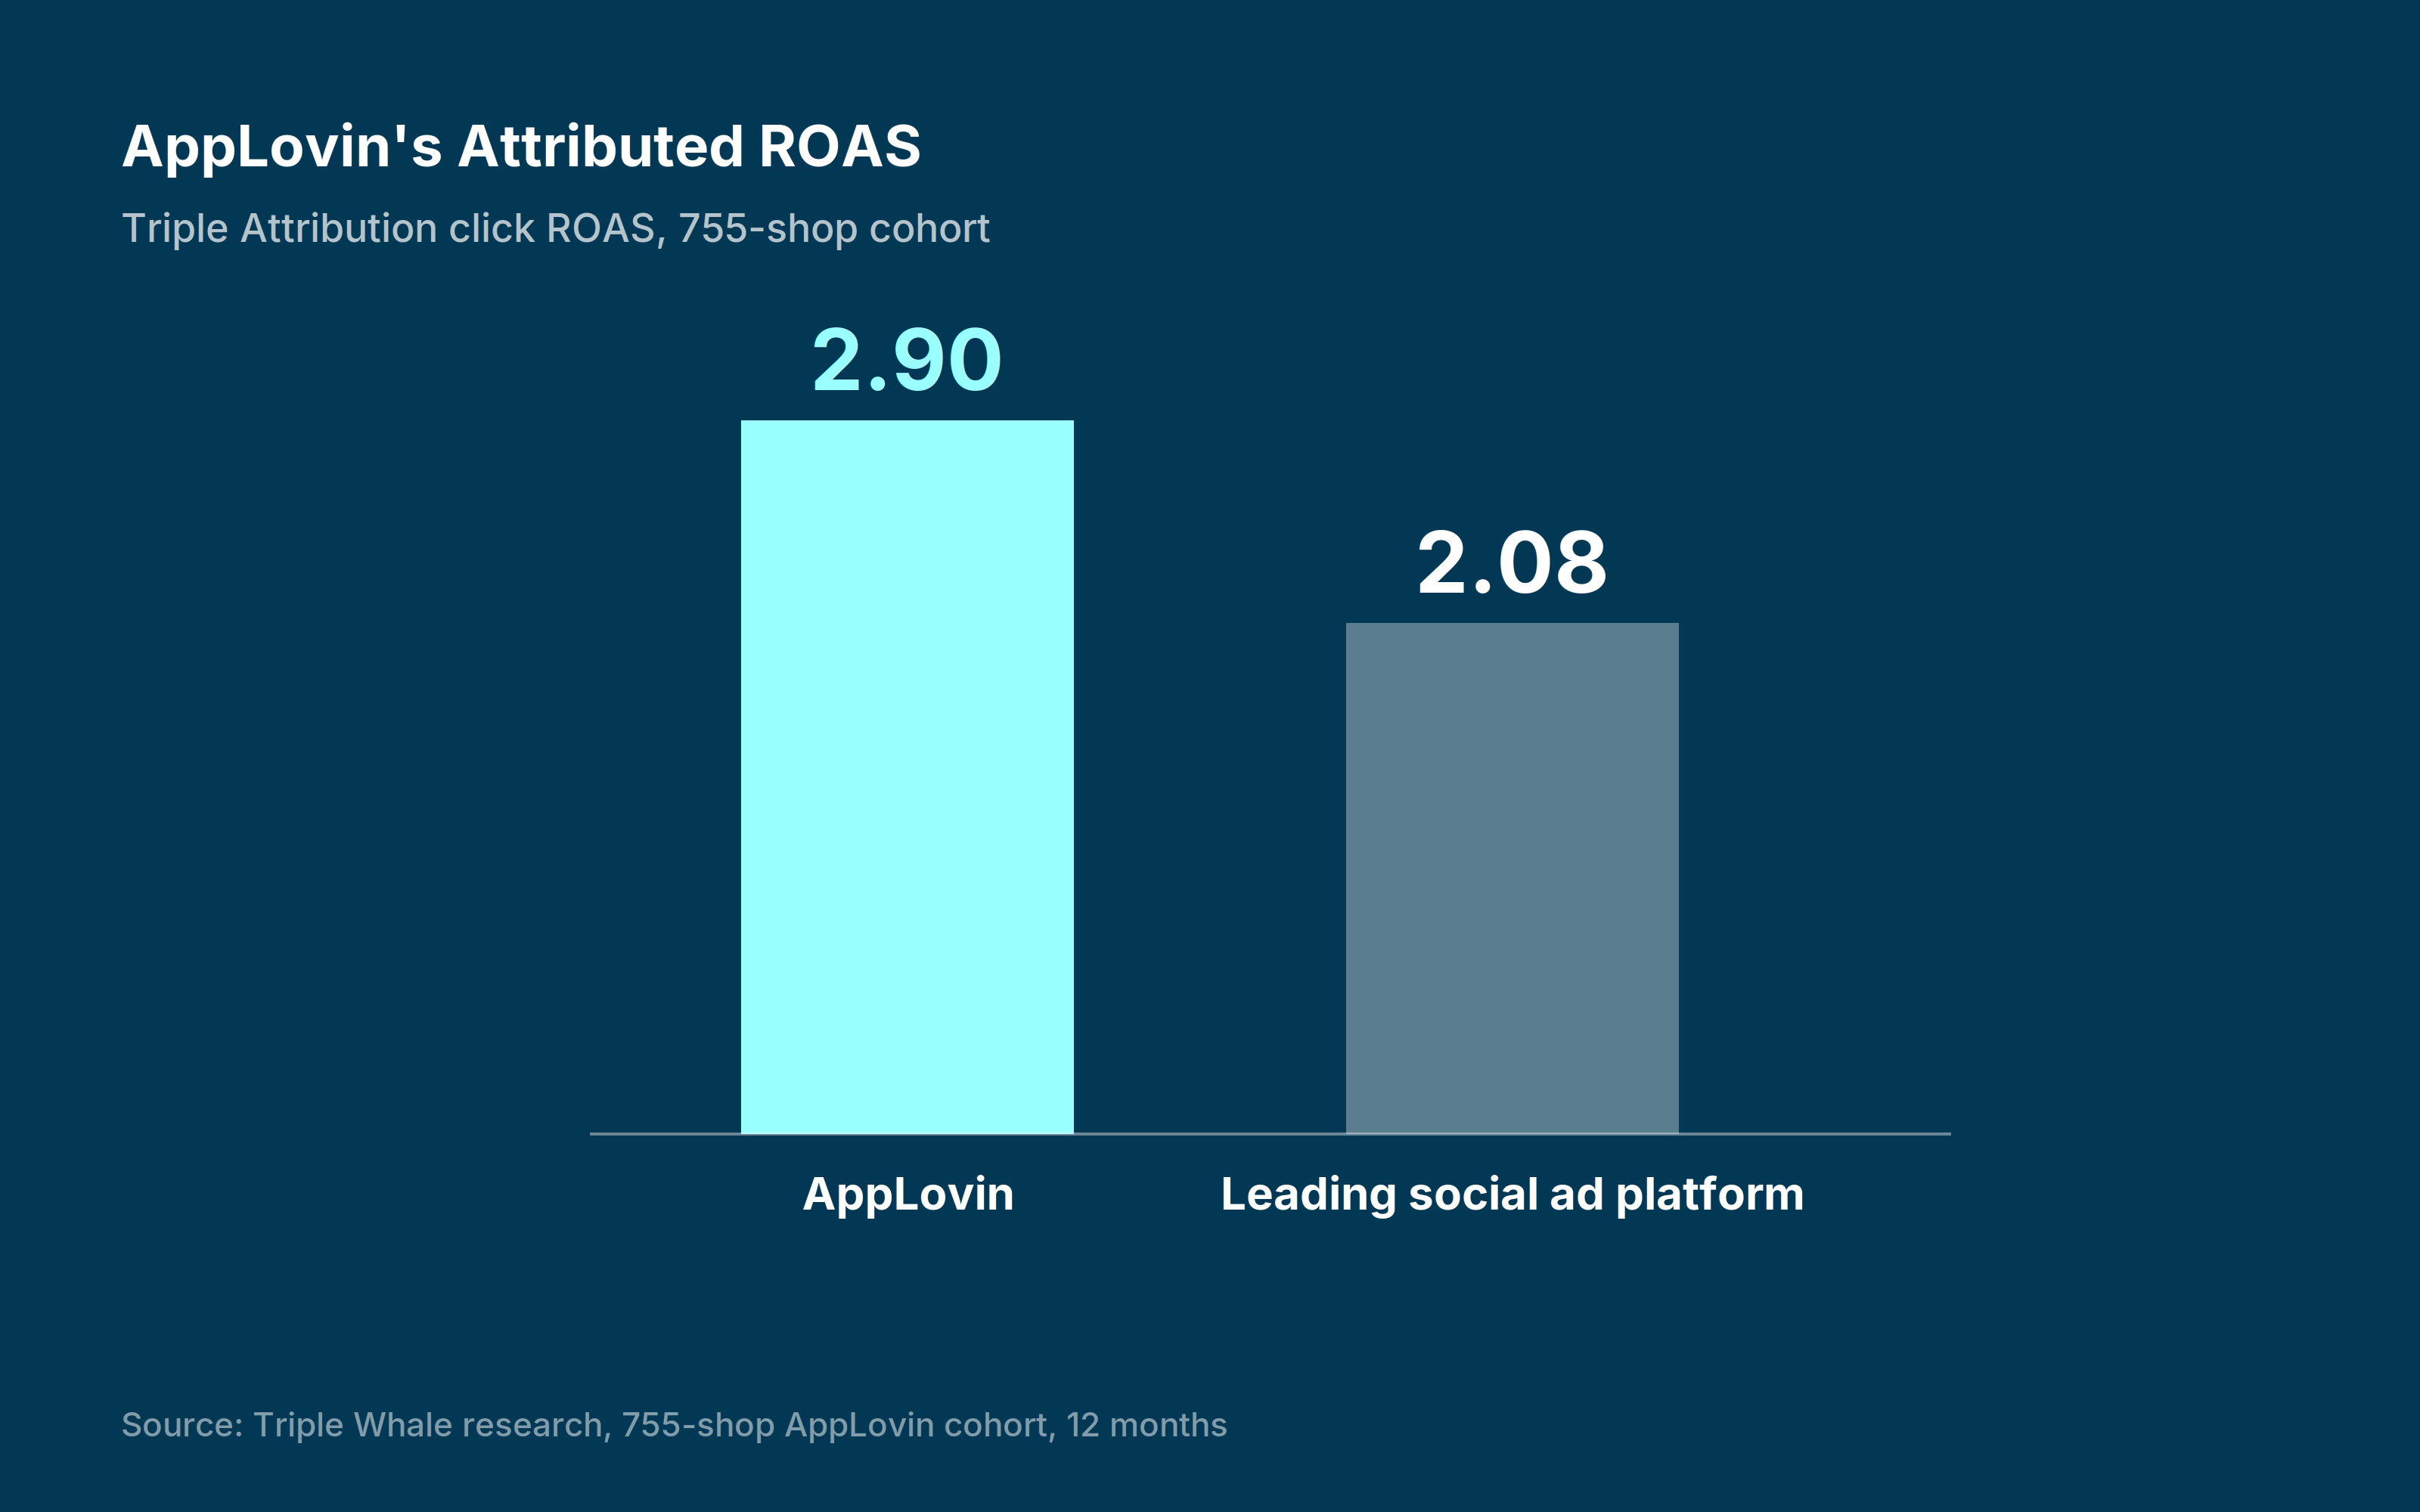
AppLovin outperformed the top ad channels across all three measurement lenses we tested: Triple Attribution model (2.90 vs. 2.08 lifetime last-click ROAS, a 61% win rate), a foundation incrementality model (66% of shops), and real-world geo holdout tests (5 of 7, all positive, averaging +8.3% revenue lift).
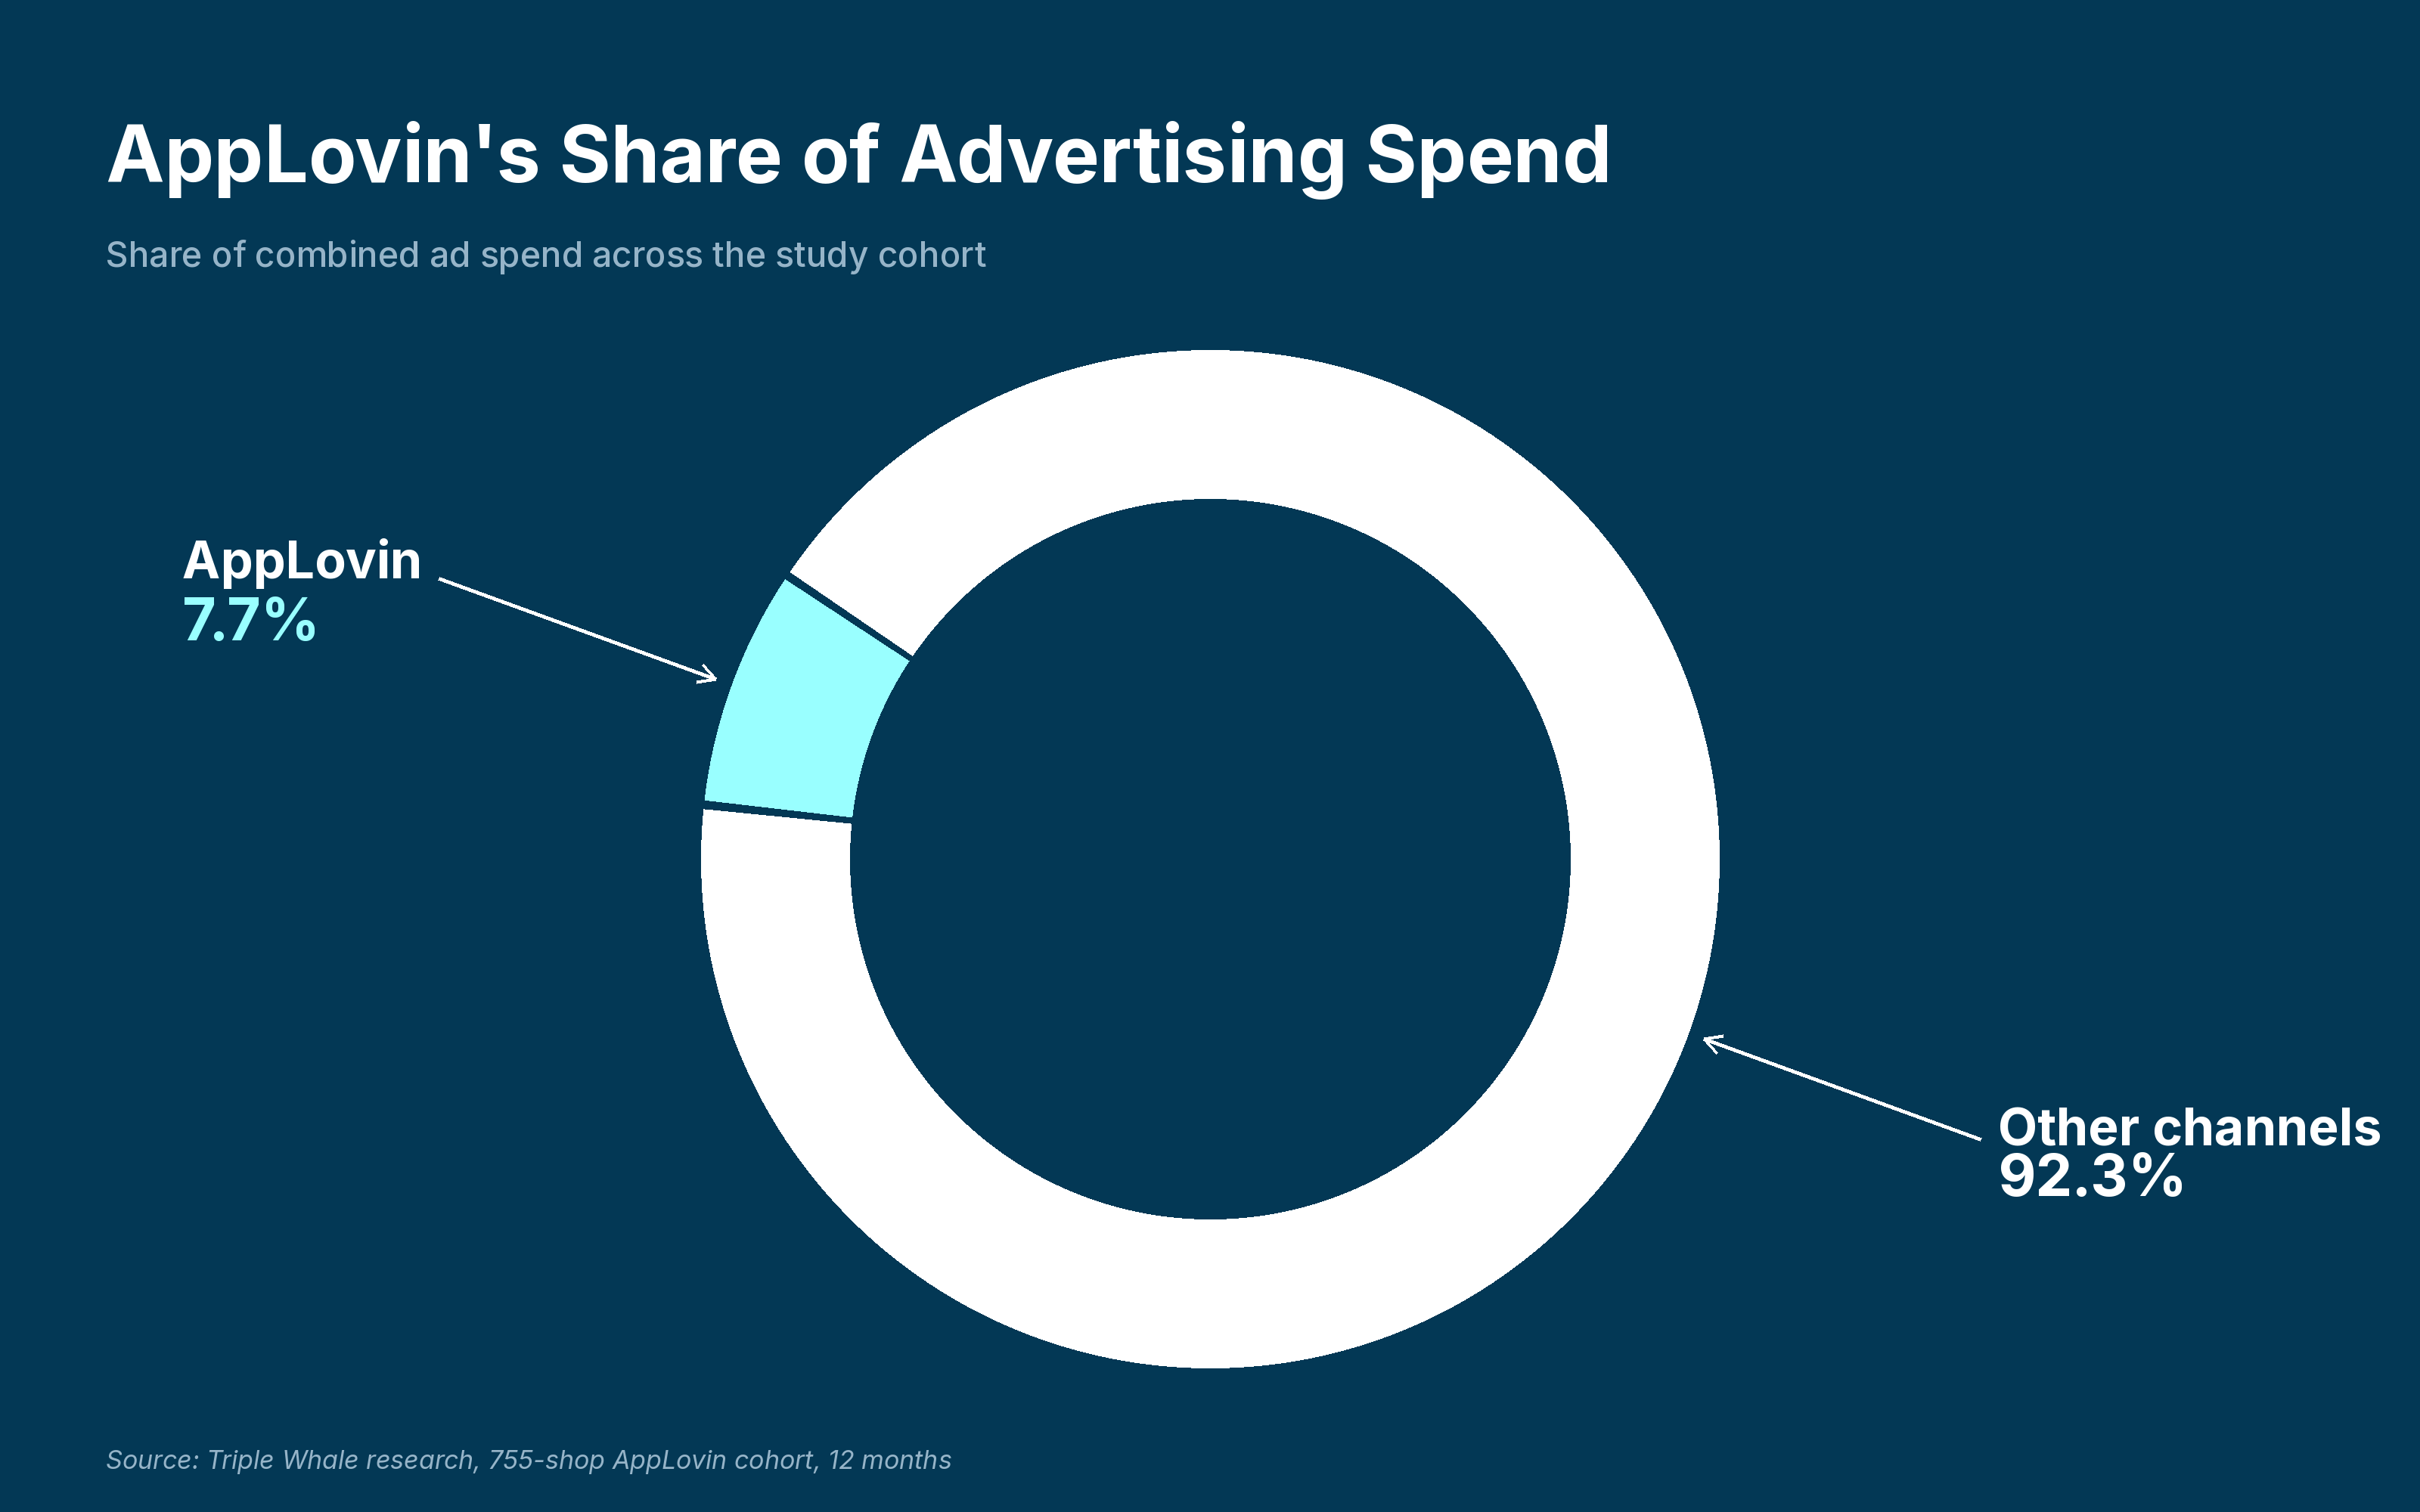
AppLovin is still a small slice of most brands' ad spend 7.7%, which looks less like a red flag and more like an early-mover opportunity, similar to where TikTok, Facebook, and Google were before they got crowded. This is a genuine opportunity to invest in a new, unsaturated channel.
About this research
We put the same question to two independent methodologies on a shared 755-shop cohort of AppLovin spenders, then checked both against real-world geo experiments.
Multi-touch attribution (MTA) compares AppLovin's last-platform-click ROAS against an established social-advertising benchmark, shop by shop, month by month.
A constrained foundation media-mix model, with industry interaction terms, multicollinearity controls, and non-negative channel effects, trained on a wider population of ~6,300 shops (the 755 AppLovin spenders plus thousands of non-AppLovin shops added as a contrast group) estimates each channel's incremental contribution, independent of which touchpoint gets credit.
Neither lens is sufficient alone: Attribution shows the role a channel plays in the journey; incrementality shows the lift it actually creates.
This research analyzes the same cohort and confirms the findings through seven separate geo holdout tests.
What attribution data says about AppLovin
Among the 755 AppLovin-spending shops in our report, lifetime Triple Attribution ROAS is stronger for AppLovin: 2.90 vs. 2.08 for the other platforms in our study.
In fact, 61% of qualifying shops saw a higher ROAS from AppLovin than from other ad channels.
It’s worth noting that AppLovin only accounts for about 7.7% of combined ad spend.
But that's actually the opportunity: less competition for the channel right now typically means stronger marginal returns for the brands willing to lean in early, similar to what early TikTok spenders saw before it got crowded.
And speaking of other platforms, we used Triple Attribution's last-platform-click model, where every channel that held the final click position on an order can receive credit. So some of AppLovin's orders may reflect demand that social channels also influenced.
That's exactly why we ran a second, independent lens to check it.
Leveraging Triple Whale’s proprietary Foundation MMM model, built on cross-shop data no single brand has
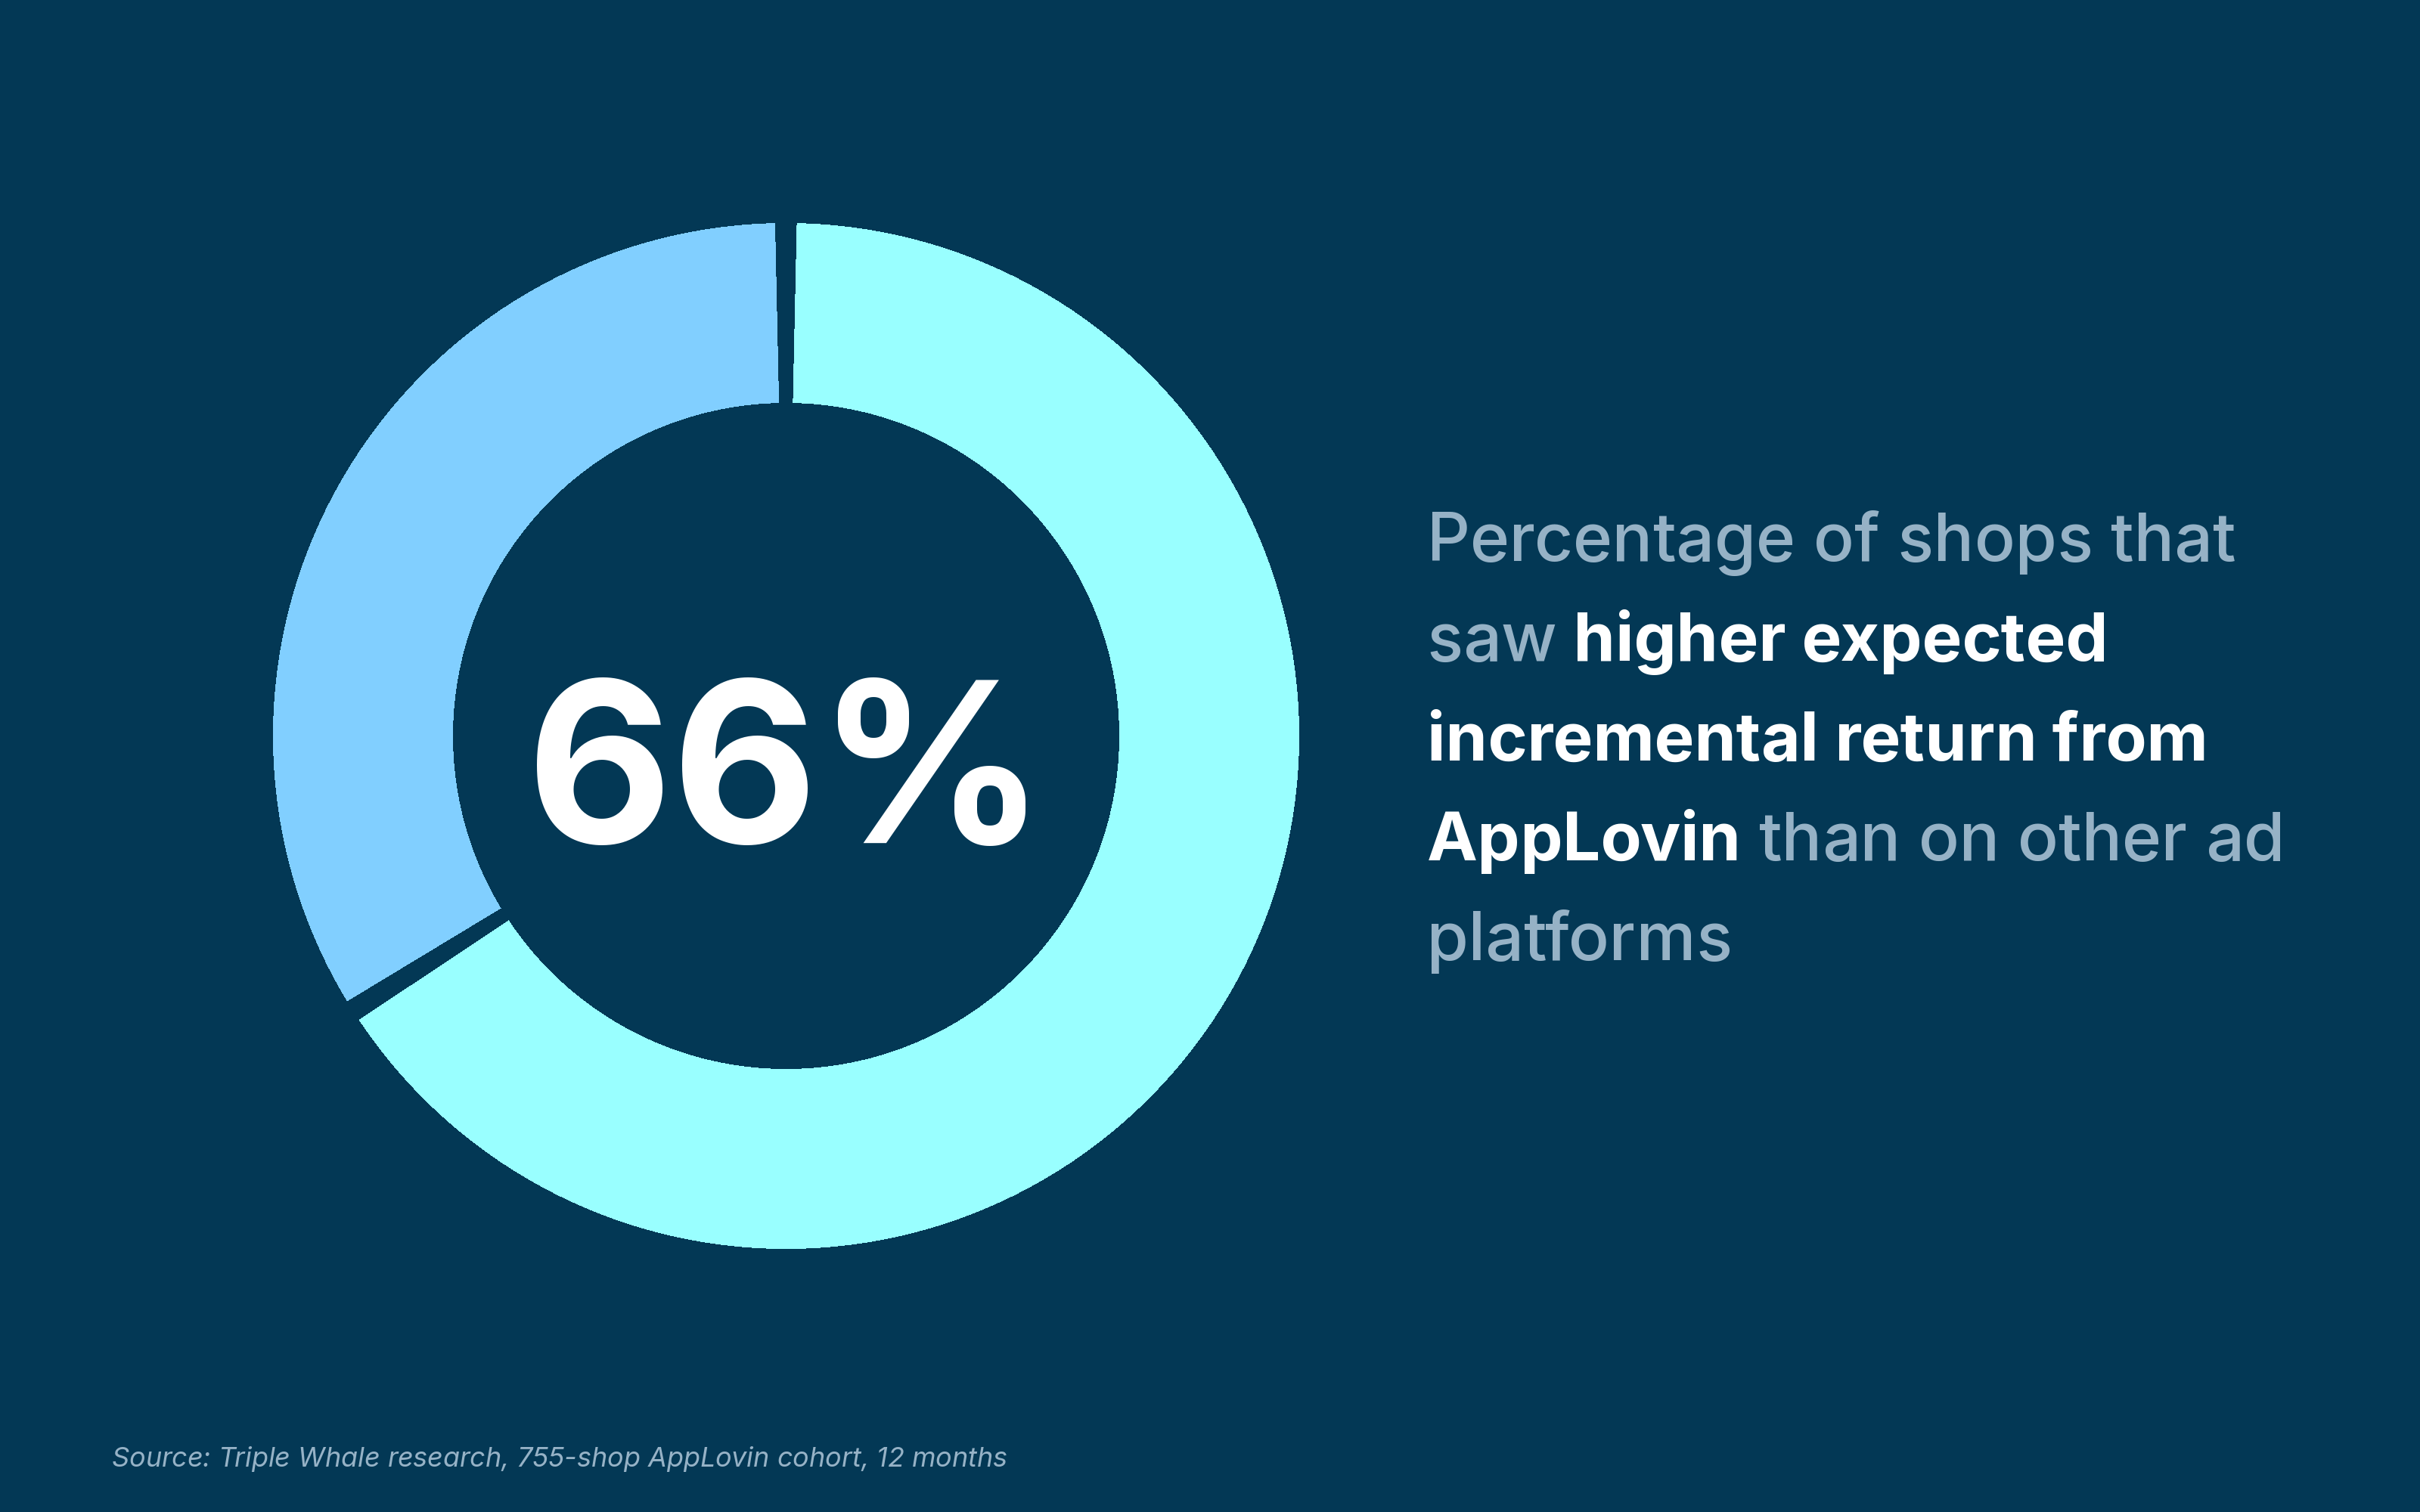
Among the 755 AppLovin-spending shops in the study cohort, 66% (two of three) showed a higher expected incremental return per additional AppLovin dollar than their own benchmark on other ad platforms.
Why trust our methods?
A standard MMM is designed to run on a single company's own data, giving that business personalized insight into how its channels are performing and then provides recommendations to meet its specific needs.
Triple Whale's advantage is scale: because we sit on a critical mass of cross-shop data, we can go further and infer generic, industry-level insight into how incremental spend per channel, by industry, is actually moving the needle (patterns no single company's own data could reveal on its own) and apply that insight back down to each individual shop.
The model was trained on roughly 6,300 shops: the 755 AppLovin spenders from the attribution study, plus a large group of non-AppLovin shops added deliberately as a contrast group.
That's a dataset no single brand could gather on its own, which is what makes the results below more than a hunch.
Here's what had to hold up for that to actually mean something:
Channel main effects. Every channel gets a shared, pooled effect estimated across the full cohort, not one shop's noisy history.
Industry-level interactions. Effects are allowed to shift by industry, so a channel that overperforms in one vertical isn't forced to look identical everywhere.
Shop-specific adstock & saturation. Each shop keeps its own decay curve and its own diminishing-returns point, so a $2K/month shop is never compared on a $200K/month curve.
Company specific controlling variables. For example AOV can differ greatly per shop, so a swing in average order value should never be mistaken for a channel effect.
The model was validated at 84% R² on 3 held-out months.
The closest thing to a real-world test: geo holdouts
Unlike attribution or modeled incrementality, geo experiments hold out real markets and measure the actual revenue difference, the closest thing to a randomized test in this research.
Test
Holdout Window
Spend Reduced
Primary Metric
Revenue Lift
Geo test 1
2026-05-28 to 2026-06-19
$16.7K
Revenue
+4.7%
Geo test 2
2026-05-07 to 2026-06-11
$152.1K
Revenue
+8.8%
Geo test 3
2026-03-11 to 2026-04-08
$90.1K
Revenue
+3.5%
Geo test 4
2026-02-26 to 2026-03-26
$18.7K
Revenue
+13.5%
Geo test 5
2025-07-10 to 2025-08-11
$33.0K
New Customer Revenue
+7.5%
Of the seven independent geo holdout tests run, five were statistically significant, and each of the five showed a positive revenue lift, averaging +8.3% and ranging from +3.5% to +13.5%.
The other two didn't reach significance. We're treating this as directional, real-world corroboration of the attribution and incrementality findings above, not as a standalone statistical claim.
Geo holdouts are also the hardest of these three methods for a brand to run on their own. It takes real coordination to hold out markets cleanly and read the results correctly. If you want to run your own, that's the kind of test Triple Whale can help set up and read.
How to test this on your own spend
If you're staring at a BFCM budget right now and wondering how much of it AppLovin deserves, here's the practical version of everything above: fund it like a real channel, not a 60-90 day toe-dip.
The evidence across all three lenses is strongest for programs that give AppLovin real budget and runway to compound, which also means BFCM week itself is the wrong time to run your first-ever test. Peak-season noise and high stakes make it an expensive environment for experimentation. Better to decide your AppLovin runway now, while you're still setting Q4 budgets, and let the channel prove itself before the crunch starts.
Validate with your own geo test: Score the channel on incremental new-customer revenue relative to your own social-channel baseline, ideally with a geo holdout. And re-measure as you scale. The calculus may shift as spend grows, so watch marginal returns, not average returns, and re-run the comparison as your budget steps up.
All three testing methods agree: AppLovin is worth betting on
All three lenses point the same way: attribution, the incrementality model, and real-world geo tests all put AppLovin ahead of the most-used ad platform benchmark for the average shop running it alongside social on the same 755-shop cohort.
But the edge is conditional: It's strongest for programs with real budget and time behind them, and it's partly a function of AppLovin still being early relative to channels that have been around much longer.
If you're finalizing Q4 channel mix in the next few weeks, that's the honest read of AppLovin: promising, worth a real test, not a reason to abandon what's already working.
Component Sales
5.32K
Benchmark your ecommerce brand against industry leaders
AppLovin spent over a decade as a mobile gaming ad network before ecommerce brands started paying attention.
That shifted fast. The platform's video-first inventory and audience reach became hard to ignore, and by 2025 it had become one of the most-discussed performance channels in DTC. The problem: That momentum hasn't been tested across all channels equally.
We examined 12 months of data acros 755 shops, so we checked, using attribution, marketing mix modeling (MMM), and real geo holdout tests, whether AppLovin is actually driving revenue, or just claiming credit for it.
Key takeaways
AppLovin outperformed the top ad channels across all three measurement lenses we tested: Triple Attribution model (2.90 vs. 2.08 lifetime last-click ROAS, a 61% win rate), a foundation incrementality model (66% of shops), and real-world geo holdout tests (5 of 7, all positive, averaging +8.3% revenue lift).
AppLovin is still a small slice of most brands' ad spend 7.7%, which looks less like a red flag and more like an early-mover opportunity, similar to where TikTok, Facebook, and Google were before they got crowded. This is a genuine opportunity to invest in a new, unsaturated channel.
About this research
We put the same question to two independent methodologies on a shared 755-shop cohort of AppLovin spenders, then checked both against real-world geo experiments.
Multi-touch attribution (MTA) compares AppLovin's last-platform-click ROAS against an established social-advertising benchmark, shop by shop, month by month.
A constrained foundation media-mix model, with industry interaction terms, multicollinearity controls, and non-negative channel effects, trained on a wider population of ~6,300 shops (the 755 AppLovin spenders plus thousands of non-AppLovin shops added as a contrast group) estimates each channel's incremental contribution, independent of which touchpoint gets credit.
Neither lens is sufficient alone: Attribution shows the role a channel plays in the journey; incrementality shows the lift it actually creates.
This research analyzes the same cohort and confirms the findings through seven separate geo holdout tests.
What attribution data says about AppLovin
Among the 755 AppLovin-spending shops in our report, lifetime Triple Attribution ROAS is stronger for AppLovin: 2.90 vs. 2.08 for the other platforms in our study.
In fact, 61% of qualifying shops saw a higher ROAS from AppLovin than from other ad channels.
It’s worth noting that AppLovin only accounts for about 7.7% of combined ad spend.
But that's actually the opportunity: less competition for the channel right now typically means stronger marginal returns for the brands willing to lean in early, similar to what early TikTok spenders saw before it got crowded.
And speaking of other platforms, we used Triple Attribution's last-platform-click model, where every channel that held the final click position on an order can receive credit. So some of AppLovin's orders may reflect demand that social channels also influenced.
That's exactly why we ran a second, independent lens to check it.
Leveraging Triple Whale’s proprietary Foundation MMM model, built on cross-shop data no single brand has
Among the 755 AppLovin-spending shops in the study cohort, 66% (two of three) showed a higher expected incremental return per additional AppLovin dollar than their own benchmark on other ad platforms.
Why trust our methods?
A standard MMM is designed to run on a single company's own data, giving that business personalized insight into how its channels are performing and then provides recommendations to meet its specific needs.
Triple Whale's advantage is scale: because we sit on a critical mass of cross-shop data, we can go further and infer generic, industry-level insight into how incremental spend per channel, by industry, is actually moving the needle (patterns no single company's own data could reveal on its own) and apply that insight back down to each individual shop.
The model was trained on roughly 6,300 shops: the 755 AppLovin spenders from the attribution study, plus a large group of non-AppLovin shops added deliberately as a contrast group.
That's a dataset no single brand could gather on its own, which is what makes the results below more than a hunch.
Here's what had to hold up for that to actually mean something:
Channel main effects. Every channel gets a shared, pooled effect estimated across the full cohort, not one shop's noisy history.
Industry-level interactions. Effects are allowed to shift by industry, so a channel that overperforms in one vertical isn't forced to look identical everywhere.
Shop-specific adstock & saturation. Each shop keeps its own decay curve and its own diminishing-returns point, so a $2K/month shop is never compared on a $200K/month curve.
Company specific controlling variables. For example AOV can differ greatly per shop, so a swing in average order value should never be mistaken for a channel effect.
The model was validated at 84% R² on 3 held-out months.
The closest thing to a real-world test: geo holdouts
Unlike attribution or modeled incrementality, geo experiments hold out real markets and measure the actual revenue difference, the closest thing to a randomized test in this research.
Test
Holdout Window
Spend Reduced
Primary Metric
Revenue Lift
Geo test 1
2026-05-28 to 2026-06-19
$16.7K
Revenue
+4.7%
Geo test 2
2026-05-07 to 2026-06-11
$152.1K
Revenue
+8.8%
Geo test 3
2026-03-11 to 2026-04-08
$90.1K
Revenue
+3.5%
Geo test 4
2026-02-26 to 2026-03-26
$18.7K
Revenue
+13.5%
Geo test 5
2025-07-10 to 2025-08-11
$33.0K
New Customer Revenue
+7.5%
Of the seven independent geo holdout tests run, five were statistically significant, and each of the five showed a positive revenue lift, averaging +8.3% and ranging from +3.5% to +13.5%.
The other two didn't reach significance. We're treating this as directional, real-world corroboration of the attribution and incrementality findings above, not as a standalone statistical claim.
Geo holdouts are also the hardest of these three methods for a brand to run on their own. It takes real coordination to hold out markets cleanly and read the results correctly. If you want to run your own, that's the kind of test Triple Whale can help set up and read.
How to test this on your own spend
If you're staring at a BFCM budget right now and wondering how much of it AppLovin deserves, here's the practical version of everything above: fund it like a real channel, not a 60-90 day toe-dip.
The evidence across all three lenses is strongest for programs that give AppLovin real budget and runway to compound, which also means BFCM week itself is the wrong time to run your first-ever test. Peak-season noise and high stakes make it an expensive environment for experimentation. Better to decide your AppLovin runway now, while you're still setting Q4 budgets, and let the channel prove itself before the crunch starts.
Validate with your own geo test: Score the channel on incremental new-customer revenue relative to your own social-channel baseline, ideally with a geo holdout. And re-measure as you scale. The calculus may shift as spend grows, so watch marginal returns, not average returns, and re-run the comparison as your budget steps up.
All three testing methods agree: AppLovin is worth betting on
All three lenses point the same way: attribution, the incrementality model, and real-world geo tests all put AppLovin ahead of the most-used ad platform benchmark for the average shop running it alongside social on the same 755-shop cohort.
But the edge is conditional: It's strongest for programs with real budget and time behind them, and it's partly a function of AppLovin still being early relative to channels that have been around much longer.
If you're finalizing Q4 channel mix in the next few weeks, that's the honest read of AppLovin: promising, worth a real test, not a reason to abandon what's already working.
Body Copy: The following benchmarks compare advertising metrics from April 1-17 to the previous period. Considering President Trump first unveiled his tariffs on April 2, the timing corresponds with potential changes in advertising behavior among ecommerce brands (though it isn’t necessarily correlated).


 Moby AIAsk questions, analyze performance, and work with your business context.
 NewActionsTake governed action across the tools that run your business.
 AutomationsSchedule recurring analysis and work that runs on your terms.
 Landing PagesCreative conversion-focused ecommerce pages with Moby.
 Creative StudioGenerate and refine creative grounded in your brand.


.png)










.webp)

.webp)
