


Customer retention rate (CRR) is one of the most vital metrics for any business that hopes to flourish long-term. Knowing how to calculate customer retention rate will help you continue to prioritize your customers.
There are a number of customer retention metrics to consider. Keep reading to learn how to measure your success using these various formulas.
What is customer retention rate? The concept is relatively straightforward: It’s a calculation of the percentage of your customers that your business retains over a specific period of time.
Let’s look at an example: Say you began 2024 with 28 customers. At the end of the year, you retained 23 of them. When you plug these numbers into the customer retention rate formula (more on that below!), you find your retention rate is 82%, meaning 82% of your customers hung in there with you all year. Not bad!
But you also need to factor in new customers you acquire throughout the year. Sticking with the same example above, losing five of your 28 customers but gaining six doesn't bump your retention over 100%. If you assume you can offset customer churn simply by adding new customers, you may be overlooking real problems with your business.
Instead, you’ll need a firm understanding of how you are retaining customers and how you are minimizing churn, which both come down to two primary factors:
Over time, developing a solid customer retention strategy will pay off: While the process takes some time and effort, it’s cheaper than acquiring new customers. In fact, customer acquisition costs can be 5 to 25 times more expensive than customer retention, according to the Harvard Business Review.
Keep up with your customer retention rate, and you will have valuable data to strategize around when it comes to improving your sales and services.
When it’s time to start calculating customer retention rate, you can plug in a few key numbers to a simple formula:
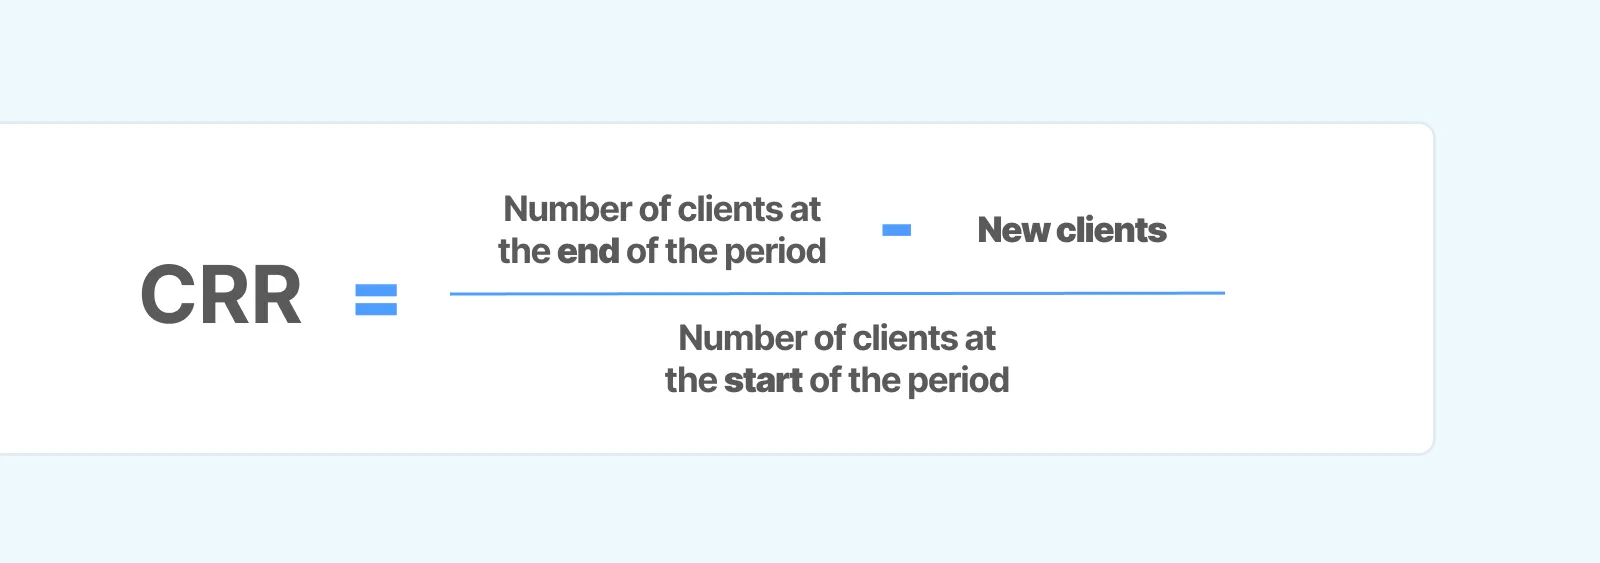
Customer retention rate = ((Total number of customers at the end of a period of time - Number of new customers during that period) ÷ Number of customers at the start of the period) x 100
Or more simply:
CRR = ((End-New)/Start) x 100
Most companies benefit from calculating how many customers they have at the start of each year, as measuring monthly or quarterly may not give you enough data to draw a helpful conclusion.
If you’re using a year as your period of time, then your “end” and “new” numbers would also be taken from that same year.
Let’s take a look at an example of a small online business calculating its customer retention rate.
This business started 2024 with 285 customers and ended the year with 225. During the year, the brand acquired 45 new customers.
Here’s how this company would calculate customer retention:
((225 - 45) ÷ 285) x 100 = 63%
A 50% retention rate would mean only half of your customers are loyal to your brand. A 70% retention rate is stronger. In an ideal world, every business would love to boast a 100% CRR. But it simply isn’t possible to avoid all customer attrition. Instead, push for the highest number you can and try to improve or increase your CRR regularly.
The first step toward doing so is to calculate client retention rate and track it over time, which gives you clear insights as to the efficacy of your retention strategy. Otherwise, you’ll be relying on guesswork and intuition about retention. Concrete CRR data can become a foundation for crafting your goals and benchmarks, as well as help you determine whether to replicate your current tactics or develop new ones.
Low retention is a red flag that your customers are not satisfied. But what is a good customer retention rate varies by industry, business size, and the products and services you offer.
Scan through the average customer retention rate by industry below, per to Statista data, to put your own CRR in context:
Like with so many other marketing metrics, CRR tells you even more about your business’s success alongside other customer retention analytics.
It’s a good idea to familiarize yourself with some of these customer retention KPIs.
You can think of your customer churn rate as the inverse of your customer retention rate. Churn, also in the form of a percentage, tells you how many customers have left your business over an established time period. Some churn is inevitable, but you want to minimize it as much as possible.
Like retention, attrition (or losing customers) also varies across industries. Businesses that sell higher-priced products often see lower churn rates because the products require a higher level of investment from customers.
Remember to keep the time period you’re looking at in mind: There’s a big difference between annual and monthly churn. A 4% monthly churn rate can have severe consequences on your success, while a 4% annual churn rate is quite manageable.
Just like customer churn is a measure of the customers you lost, revenue churn is a measure of monthly recurring revenue you lost over a given time period. You can calculate revenue churn rate on a net or gross basis in the form of a percentage, and you want this number to be low.
Whatever your revenue churn rate comes out to, it won’t give you any insight on exactly how many customers you’re retaining. But it will give you a clear picture of the effect your existing customers have on your bottom line. And when you analyze revenue churn alongside customer churn, you might notice interesting and sometimes surprising trends about retention. For example, if you lose low-value customers, you might notice revenue isn’t affected much at all, meaning you can remain profitable even if this segment of shoppers isn’t retained.
This measurement comes from survey responses from your shoppers. Customers are asked how likely they are to recommend your brand to someone, usually on a scale of “unlikely” to “highly likely.” Of course, you want to score highly, because that positive word of mouth is good for business! But customers who are willing to refer others to your brand are also more likely to purchase from you again.
Repeat customer rate or repeat purchase rate tells you what percentage of your shoppers have made at least two purchases with you, and you want this number to be high. Buying from you and then buying again is a good sign your customers are satisfied with the experience of interacting with your brand and happy with their purchase. If this number is low, you may have some room for improvement.
Customer lifetime value is a measurement in a monetary value that tells you how much money your average customer will spend at your company throughout their relationship with your brand.
You can calculate CLV at a business, customer service, or individual level, and you can use it to help guide decisions like how much to allocate to improving customer experience.
Another post-purchase survey you can consider sending to shoppers is the customer satisfaction score. You’ll generally ask for feedback on their latest purchase on a scale of 1 (not satisfied) to 5 (very satisfied). Here, you’re looking for a high score: A more satisfied customer is more likely to become a retained customer.
Customer effort score or CES measures how challenging it is for your shopper to interact with your brand on a scale of 1 (easy) to 5 (very difficult), according to Harvard Business Review. You want your CES to be low, meaning your audience finds it simple to navigate your site and make purchases from your store. The easier they find these interactions, the more likely they are to stick around. And addressing the obstacles that make these interactions more challenging might encourage more conversions, too. (Customer journey analytics can help you identify the stage in your customer lifecycle where shoppers might be encountering some of these barriers.)
Armed with the data above, you might now be wondering if there’s anything you can do to improve the situation you find yourself in. Here at Triple Whale, we recommend loads of different customer retention strategies to help you retain customers. Some of the standbys include:
Maintaining your existing customer base is much less expensive than employing resources to acquire new customers. That's why your company should be monitoring and managing customer retention metrics like customer retention rate, churn rate, and customer lifetime value.
When you regularly track and analyze these metrics, you’ll have a clearer sense of where you need to make improvements to your customer retention strategy. If you keep iterating, before long, you’ll notice you’re keeping more of your customers satisfied and your sales data reflect that loyalty.
Triple Whale can help you understand how to work out customer retention rate and improve your results. Book a demo today to learn more about our suite of results-driven retention tools.
Customer retention rate (CRR) is one of the most vital metrics for any business that hopes to flourish long-term. Knowing how to calculate customer retention rate will help you continue to prioritize your customers.
There are a number of customer retention metrics to consider. Keep reading to learn how to measure your success using these various formulas.
What is customer retention rate? The concept is relatively straightforward: It’s a calculation of the percentage of your customers that your business retains over a specific period of time.
Let’s look at an example: Say you began 2024 with 28 customers. At the end of the year, you retained 23 of them. When you plug these numbers into the customer retention rate formula (more on that below!), you find your retention rate is 82%, meaning 82% of your customers hung in there with you all year. Not bad!
But you also need to factor in new customers you acquire throughout the year. Sticking with the same example above, losing five of your 28 customers but gaining six doesn't bump your retention over 100%. If you assume you can offset customer churn simply by adding new customers, you may be overlooking real problems with your business.
Instead, you’ll need a firm understanding of how you are retaining customers and how you are minimizing churn, which both come down to two primary factors:
Over time, developing a solid customer retention strategy will pay off: While the process takes some time and effort, it’s cheaper than acquiring new customers. In fact, customer acquisition costs can be 5 to 25 times more expensive than customer retention, according to the Harvard Business Review.
Keep up with your customer retention rate, and you will have valuable data to strategize around when it comes to improving your sales and services.
When it’s time to start calculating customer retention rate, you can plug in a few key numbers to a simple formula:
Customer retention rate = ((Total number of customers at the end of a period of time - Number of new customers during that period) ÷ Number of customers at the start of the period) x 100
Or more simply:
CRR = ((End-New)/Start) x 100
Most companies benefit from calculating how many customers they have at the start of each year, as measuring monthly or quarterly may not give you enough data to draw a helpful conclusion.
If you’re using a year as your period of time, then your “end” and “new” numbers would also be taken from that same year.
Let’s take a look at an example of a small online business calculating its customer retention rate.
This business started 2024 with 285 customers and ended the year with 225. During the year, the brand acquired 45 new customers.
Here’s how this company would calculate customer retention:
((225 - 45) ÷ 285) x 100 = 63%
A 50% retention rate would mean only half of your customers are loyal to your brand. A 70% retention rate is stronger. In an ideal world, every business would love to boast a 100% CRR. But it simply isn’t possible to avoid all customer attrition. Instead, push for the highest number you can and try to improve or increase your CRR regularly.
The first step toward doing so is to calculate client retention rate and track it over time, which gives you clear insights as to the efficacy of your retention strategy. Otherwise, you’ll be relying on guesswork and intuition about retention. Concrete CRR data can become a foundation for crafting your goals and benchmarks, as well as help you determine whether to replicate your current tactics or develop new ones.
Low retention is a red flag that your customers are not satisfied. But what is a good customer retention rate varies by industry, business size, and the products and services you offer.
Scan through the average customer retention rate by industry below, per to Statista data, to put your own CRR in context:
Like with so many other marketing metrics, CRR tells you even more about your business’s success alongside other customer retention analytics.
It’s a good idea to familiarize yourself with some of these customer retention KPIs.
You can think of your customer churn rate as the inverse of your customer retention rate. Churn, also in the form of a percentage, tells you how many customers have left your business over an established time period. Some churn is inevitable, but you want to minimize it as much as possible.
Like retention, attrition (or losing customers) also varies across industries. Businesses that sell higher-priced products often see lower churn rates because the products require a higher level of investment from customers.
Remember to keep the time period you’re looking at in mind: There’s a big difference between annual and monthly churn. A 4% monthly churn rate can have severe consequences on your success, while a 4% annual churn rate is quite manageable.
Just like customer churn is a measure of the customers you lost, revenue churn is a measure of monthly recurring revenue you lost over a given time period. You can calculate revenue churn rate on a net or gross basis in the form of a percentage, and you want this number to be low.
Whatever your revenue churn rate comes out to, it won’t give you any insight on exactly how many customers you’re retaining. But it will give you a clear picture of the effect your existing customers have on your bottom line. And when you analyze revenue churn alongside customer churn, you might notice interesting and sometimes surprising trends about retention. For example, if you lose low-value customers, you might notice revenue isn’t affected much at all, meaning you can remain profitable even if this segment of shoppers isn’t retained.
This measurement comes from survey responses from your shoppers. Customers are asked how likely they are to recommend your brand to someone, usually on a scale of “unlikely” to “highly likely.” Of course, you want to score highly, because that positive word of mouth is good for business! But customers who are willing to refer others to your brand are also more likely to purchase from you again.
Repeat customer rate or repeat purchase rate tells you what percentage of your shoppers have made at least two purchases with you, and you want this number to be high. Buying from you and then buying again is a good sign your customers are satisfied with the experience of interacting with your brand and happy with their purchase. If this number is low, you may have some room for improvement.
Customer lifetime value is a measurement in a monetary value that tells you how much money your average customer will spend at your company throughout their relationship with your brand.
You can calculate CLV at a business, customer service, or individual level, and you can use it to help guide decisions like how much to allocate to improving customer experience.
Another post-purchase survey you can consider sending to shoppers is the customer satisfaction score. You’ll generally ask for feedback on their latest purchase on a scale of 1 (not satisfied) to 5 (very satisfied). Here, you’re looking for a high score: A more satisfied customer is more likely to become a retained customer.
Customer effort score or CES measures how challenging it is for your shopper to interact with your brand on a scale of 1 (easy) to 5 (very difficult), according to Harvard Business Review. You want your CES to be low, meaning your audience finds it simple to navigate your site and make purchases from your store. The easier they find these interactions, the more likely they are to stick around. And addressing the obstacles that make these interactions more challenging might encourage more conversions, too. (Customer journey analytics can help you identify the stage in your customer lifecycle where shoppers might be encountering some of these barriers.)
Armed with the data above, you might now be wondering if there’s anything you can do to improve the situation you find yourself in. Here at Triple Whale, we recommend loads of different customer retention strategies to help you retain customers. Some of the standbys include:
Maintaining your existing customer base is much less expensive than employing resources to acquire new customers. That's why your company should be monitoring and managing customer retention metrics like customer retention rate, churn rate, and customer lifetime value.
When you regularly track and analyze these metrics, you’ll have a clearer sense of where you need to make improvements to your customer retention strategy. If you keep iterating, before long, you’ll notice you’re keeping more of your customers satisfied and your sales data reflect that loyalty.
Triple Whale can help you understand how to work out customer retention rate and improve your results. Book a demo today to learn more about our suite of results-driven retention tools.
.webp)

Body Copy: The following benchmarks compare advertising metrics from April 1-17 to the previous period. Considering President Trump first unveiled his tariffs on April 2, the timing corresponds with potential changes in advertising behavior among ecommerce brands (though it isn’t necessarily correlated).


.webp)

.webp)


.png)


.png)
