


Every ecommerce brand has experienced it: an ad that was printing money last month is suddenly hemorrhaging budget. CPA has doubled. CTR is cratering. And by the time you notice, you’ve already wasted weeks of spend on a creative that the algorithm quietly stopped believing in.
Creative fatigue will always happen, but the real issue is that most brands detect it too late. They wait for ROAS to collapse before acting, missing that fatigue degrades metrics in a specific, predictable sequence, and ROAS happens to be the last thing that moves.
The framework outlined in this blog gives you a structured method for catching fatigue early, deciding how severe it is, and knowing exactly when and how to intervene.
Over a single day, ad metrics fluctuate due to auction competition, day-of-week effects, and algorithmic variance. If a brand reacts to a daily performance drop, it risks premature creative retirement or unnecessary account churn.
The fix is trend analysis across defined performance windows. A 10-15% week-over-week decline in CTR is meaningful. A single bad day is not. Set a minimum evaluation window of 7-10 days before making any creative decisions.
To get a clear read on how ads are performing, evaluate them using both a short-term and long-term window. Any metric showing consistent decline across both windows warrants closer investigation.
The 7-day window captures recent directional trends. The key question here: is performance moving up or down consistently? You can use this performance to flag ads that need closer review. The threshold for review is two or more consecutive days of decline across two or more metrics.
The 30-day baseline establishes the creative’s performance standard. The key question here: how far is current performance from the creative’s peak? Use it to confirm whether what you’re seeing is fatigue or normal variance. The threshold for review is a greater-than-15% decline from the 30-day average on key metrics.
An ad that’s down 8% today but running above its 30-day average is likely fine. An ad that’s down 8% for six days running and is now 20% below its 30-day peak is fatigued — regardless of whether ROAS is still technically positive.
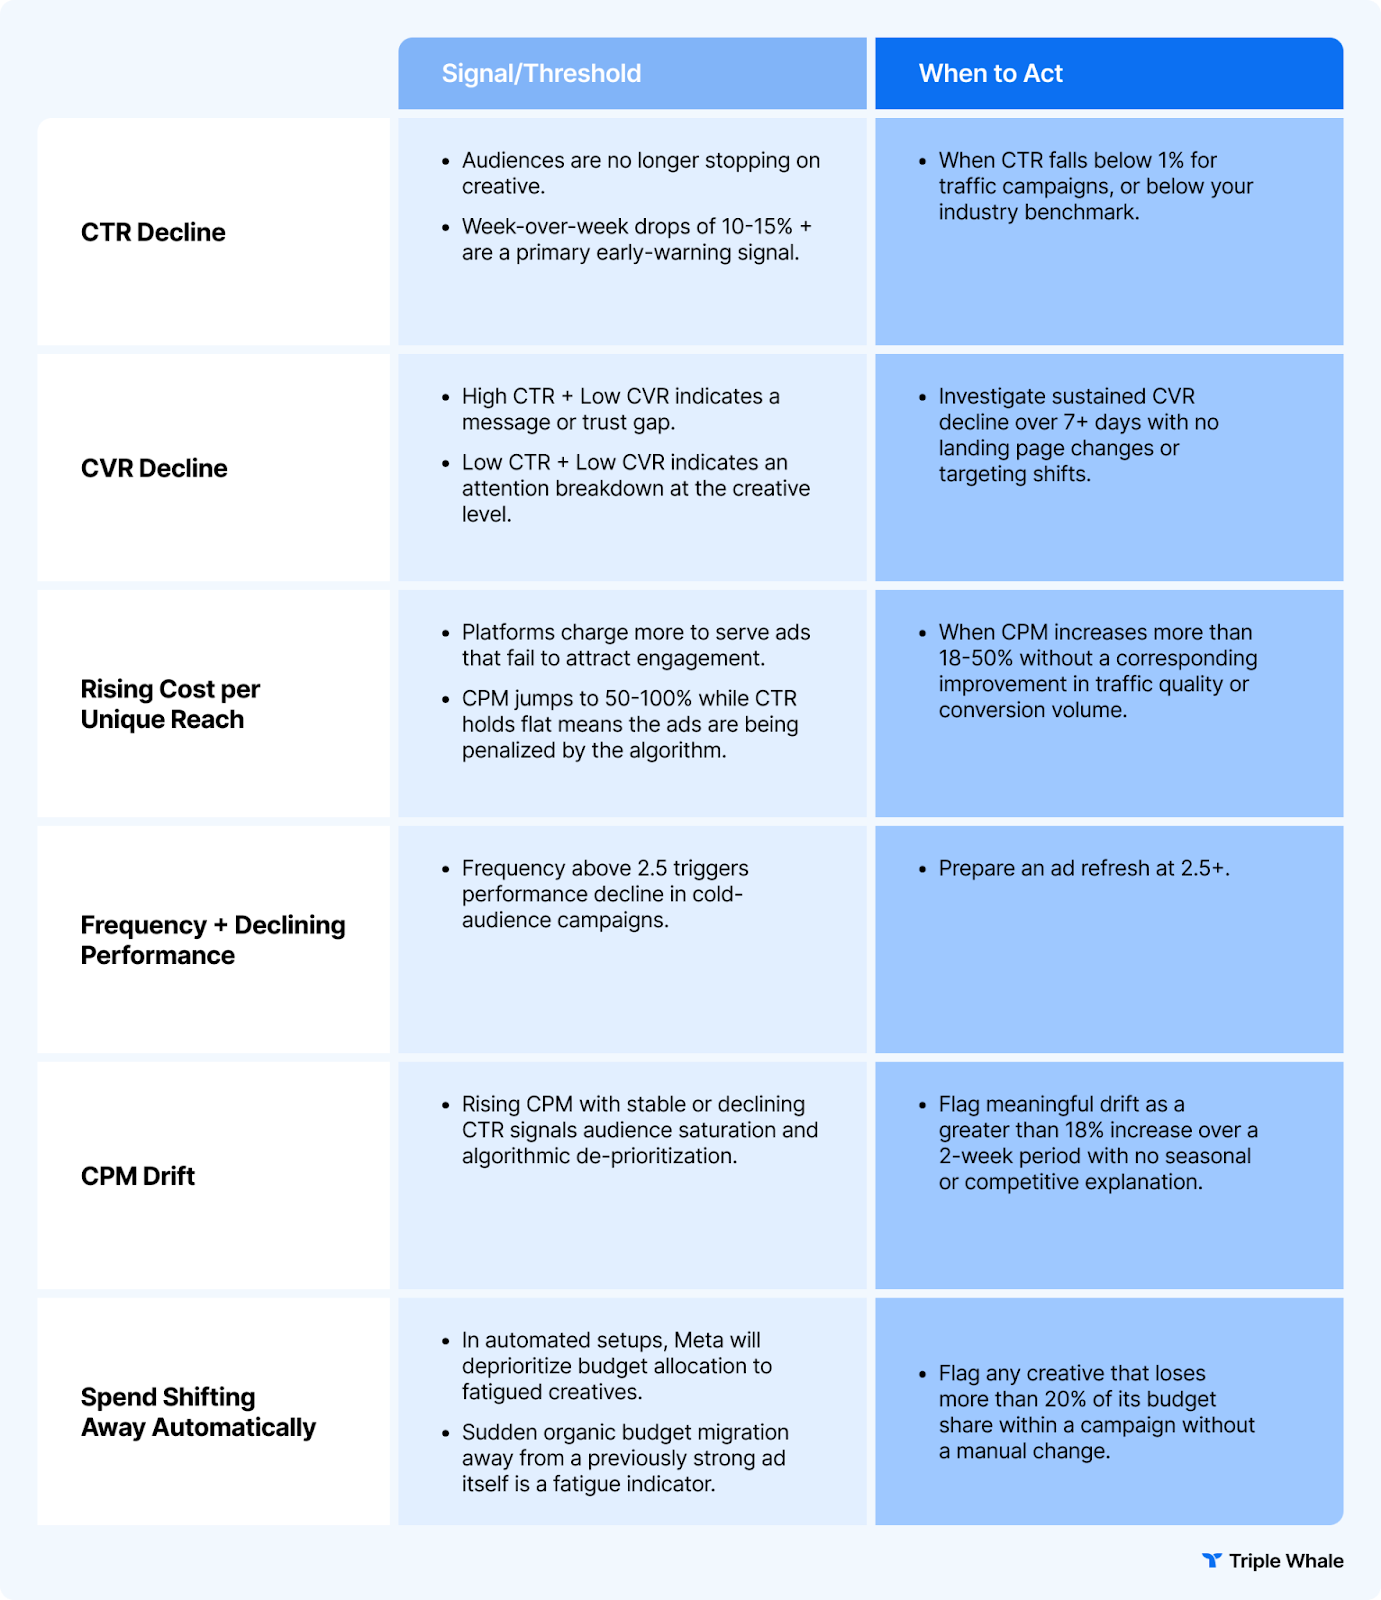
Fatigue shows up differently in each metric, and each tells you something specific about what’s breaking down.
Beyond the core metrics, several secondary signals can give you earlier warning:
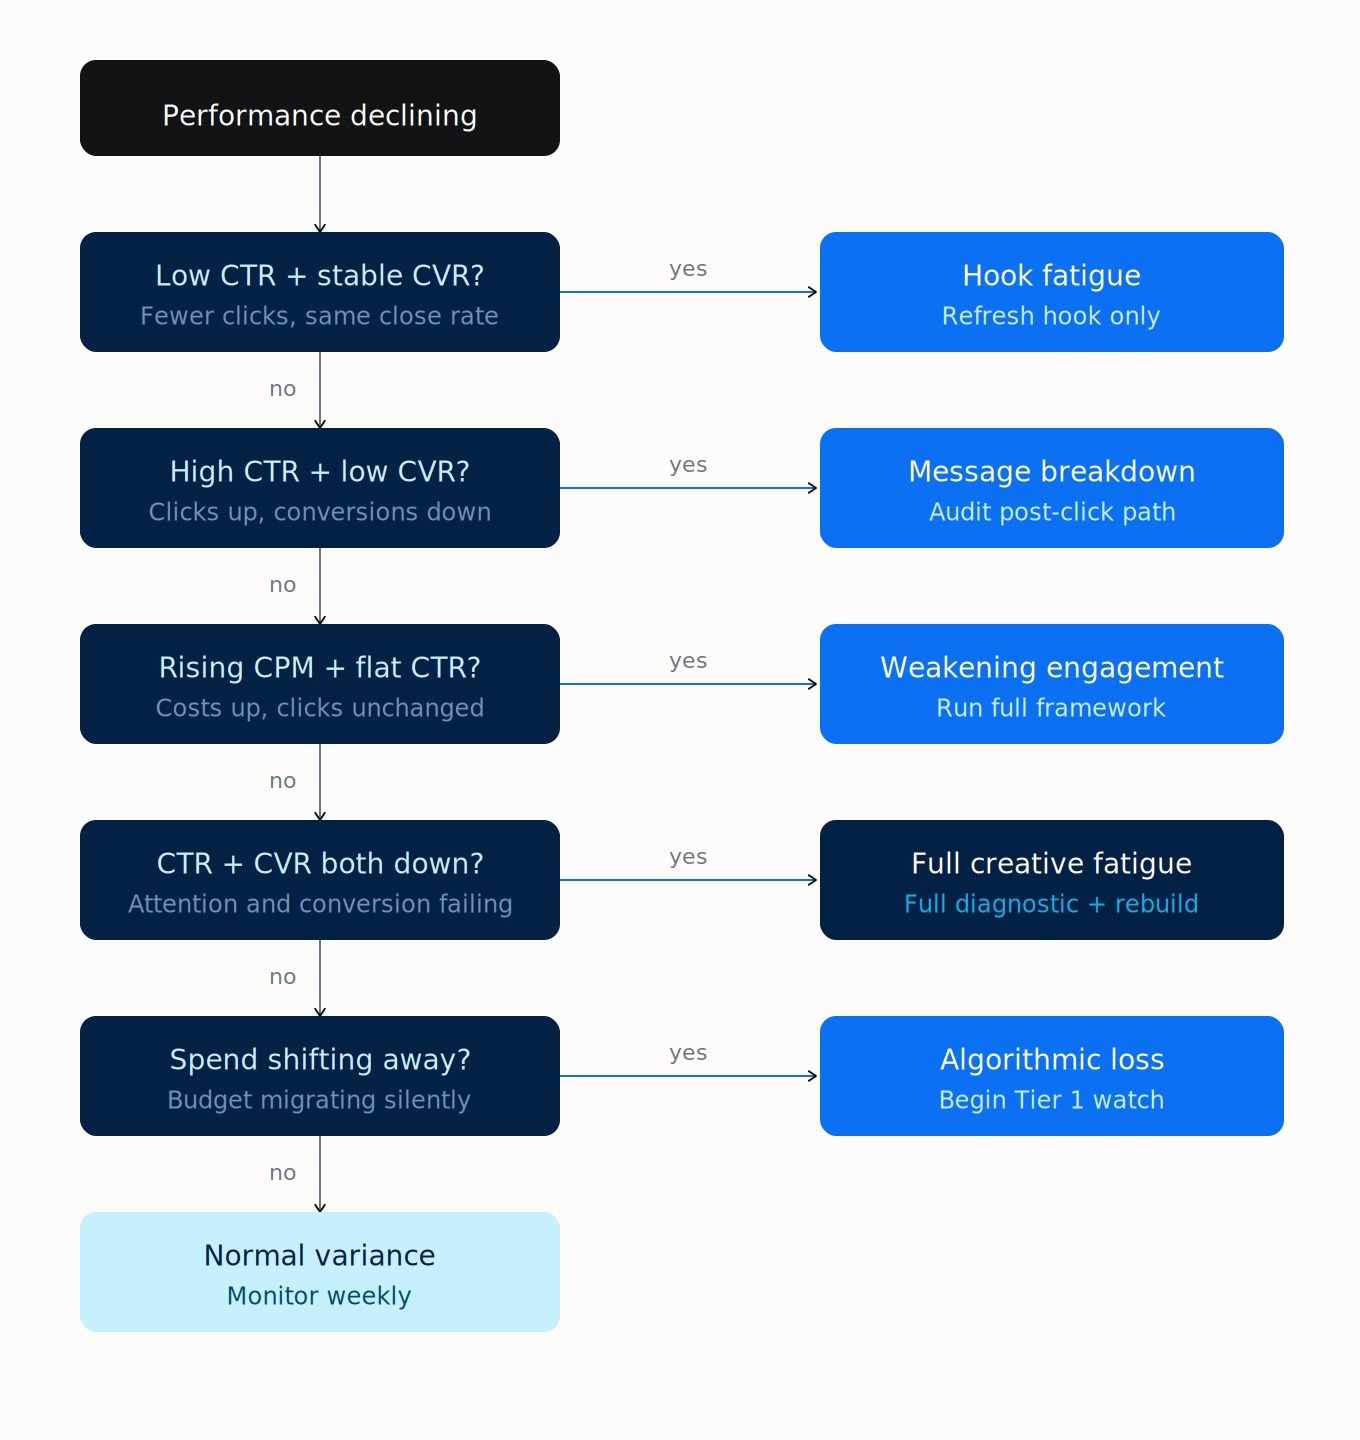
Not all declining metrics warrant the same response. The appropriate intervention depends on how far performance has degraded and how many signals are converging.
The ad shows a 10–15% decline in one or two metrics over 7 days, but performance is still above the 30-day baseline. Don't change the ad yet — but begin briefing replacement concepts. Use the window to prepare so you're ready when the decline accelerates.
The ad shows a 20–30% decline across two or more metrics over 7 days, and performance is now below the 30-day baseline. Diagnose the issue first. If a single component is failing (just the hook, for instance), change 30–40% of the elements while keeping the message, visual, and offer intact. If multiple components are failing, move to a full rebuild — new angle, new hook, new visual — while keeping core product positioning. Reduce spend 50% while diagnosis and refresh are in progress.
CTR is down 40% or more, costs have doubled, and the algorithm has stopped spending on the creative. Pause it immediately. Before archiving, extract whatever learnings you can: hook structure, angle, format wins. Then launch a replacement built around a genuinely new structural concept.
When an ad starts to fatigue, Meta's delivery algorithm actively reduces budget allocation, reallocates spend to other ads, and updates its relevance model for that creative. Each response accelerates the decline.
The cost of inaction is real. Research suggests that 49% of consumers decide not to buy from a brand after seeing the same ad too many times. Without a structured review process, an estimated 15–25% of monthly ad spend is typically wasted on already-fatigued creative.
Fatigue in Meta is now less visible than it used to be — conversion rates can dip even while CTR remains stable, and day-to-day results become volatile rather than predictable. By the time CPAs noticeably spike, teams are reacting under pressure instead of managing proactively.
The framework works, but only if it runs every week — including when everything looks fine. Pull your last 30 days of creative performance. Flag every ad where two or more metrics have declined over the past 7 days. For the top three flagged ads, run the diagnostic: name the failure pattern, map it to a metric signature, and brief a replacement that addresses what actually broke.
That weekly loop is what separates brands that scale from brands that stall.
Every ecommerce brand has experienced it: an ad that was printing money last month is suddenly hemorrhaging budget. CPA has doubled. CTR is cratering. And by the time you notice, you’ve already wasted weeks of spend on a creative that the algorithm quietly stopped believing in.
Creative fatigue will always happen, but the real issue is that most brands detect it too late. They wait for ROAS to collapse before acting, missing that fatigue degrades metrics in a specific, predictable sequence, and ROAS happens to be the last thing that moves.
The framework outlined in this blog gives you a structured method for catching fatigue early, deciding how severe it is, and knowing exactly when and how to intervene.
Over a single day, ad metrics fluctuate due to auction competition, day-of-week effects, and algorithmic variance. If a brand reacts to a daily performance drop, it risks premature creative retirement or unnecessary account churn.
The fix is trend analysis across defined performance windows. A 10-15% week-over-week decline in CTR is meaningful. A single bad day is not. Set a minimum evaluation window of 7-10 days before making any creative decisions.
To get a clear read on how ads are performing, evaluate them using both a short-term and long-term window. Any metric showing consistent decline across both windows warrants closer investigation.
The 7-day window captures recent directional trends. The key question here: is performance moving up or down consistently? You can use this performance to flag ads that need closer review. The threshold for review is two or more consecutive days of decline across two or more metrics.
The 30-day baseline establishes the creative’s performance standard. The key question here: how far is current performance from the creative’s peak? Use it to confirm whether what you’re seeing is fatigue or normal variance. The threshold for review is a greater-than-15% decline from the 30-day average on key metrics.
An ad that’s down 8% today but running above its 30-day average is likely fine. An ad that’s down 8% for six days running and is now 20% below its 30-day peak is fatigued — regardless of whether ROAS is still technically positive.
Fatigue shows up differently in each metric, and each tells you something specific about what’s breaking down.
Beyond the core metrics, several secondary signals can give you earlier warning:
Not all declining metrics warrant the same response. The appropriate intervention depends on how far performance has degraded and how many signals are converging.
The ad shows a 10–15% decline in one or two metrics over 7 days, but performance is still above the 30-day baseline. Don't change the ad yet — but begin briefing replacement concepts. Use the window to prepare so you're ready when the decline accelerates.
The ad shows a 20–30% decline across two or more metrics over 7 days, and performance is now below the 30-day baseline. Diagnose the issue first. If a single component is failing (just the hook, for instance), change 30–40% of the elements while keeping the message, visual, and offer intact. If multiple components are failing, move to a full rebuild — new angle, new hook, new visual — while keeping core product positioning. Reduce spend 50% while diagnosis and refresh are in progress.
CTR is down 40% or more, costs have doubled, and the algorithm has stopped spending on the creative. Pause it immediately. Before archiving, extract whatever learnings you can: hook structure, angle, format wins. Then launch a replacement built around a genuinely new structural concept.
When an ad starts to fatigue, Meta's delivery algorithm actively reduces budget allocation, reallocates spend to other ads, and updates its relevance model for that creative. Each response accelerates the decline.
The cost of inaction is real. Research suggests that 49% of consumers decide not to buy from a brand after seeing the same ad too many times. Without a structured review process, an estimated 15–25% of monthly ad spend is typically wasted on already-fatigued creative.
Fatigue in Meta is now less visible than it used to be — conversion rates can dip even while CTR remains stable, and day-to-day results become volatile rather than predictable. By the time CPAs noticeably spike, teams are reacting under pressure instead of managing proactively.
The framework works, but only if it runs every week — including when everything looks fine. Pull your last 30 days of creative performance. Flag every ad where two or more metrics have declined over the past 7 days. For the top three flagged ads, run the diagnostic: name the failure pattern, map it to a metric signature, and brief a replacement that addresses what actually broke.
That weekly loop is what separates brands that scale from brands that stall.

A structured framework for detecting ad creative fatigue early using metric patterns, 7-day vs. 30-day comparison windows, intervention tiers, and actionable thresholds — before ROAS collapses.
Body Copy: The following benchmarks compare advertising metrics from April 1-17 to the previous period. Considering President Trump first unveiled his tariffs on April 2, the timing corresponds with potential changes in advertising behavior among ecommerce brands (though it isn’t necessarily correlated).


.webp)

.webp)


.png)


.png)
