


Discounting is an art.
There’s a fine balance between running heavy discounts and keeping products at their original price, which yields the highest profit margin. If you discount too heavily and too often, you risk training your customers to expect sales. And if you don’t discount frequently enough, you might miss out on sales from potential new customers attracted by your offer.
We partnered with Particl to analyze how Apparel and Health & Beauty brands structure their discount levels, as well as how average order value (AOV) changes over time for a 105-week period from October 2023 through September 2025. This analysis revealed that the top brands in each vertical approached discounting in a much different way than the market at large.
The top 10 Apparel brands discounted at a rate 1.3x higher than market average, while the top 10 Health & Beauty brands discounted at a rate 2.5x higher.
This raises an interesting question: Are the top brands succeeding because of their aggressive discounting, or can they simply afford to discount more heavily because they’re already market leaders? The reality likely involves both dynamics, but understanding what separates their approach from the market’s steady, moderate discounting reveals crucial insights about competitive positioning in these massive categories.
We also analyzed transaction data from over 20,000 brands to understand seasonal shopping patterns and the impact on AOV.
Where Health & Beauty basket sizes stay consistent year-round, Apparel customers tend to make larger, less frequent purchases tied to specific occasions or needs.
In this article, we’ll take a deep dive into discount strategies and AOV to understand what top performers do differently than brands in the broader market, and why these strategies can help brands succeed.
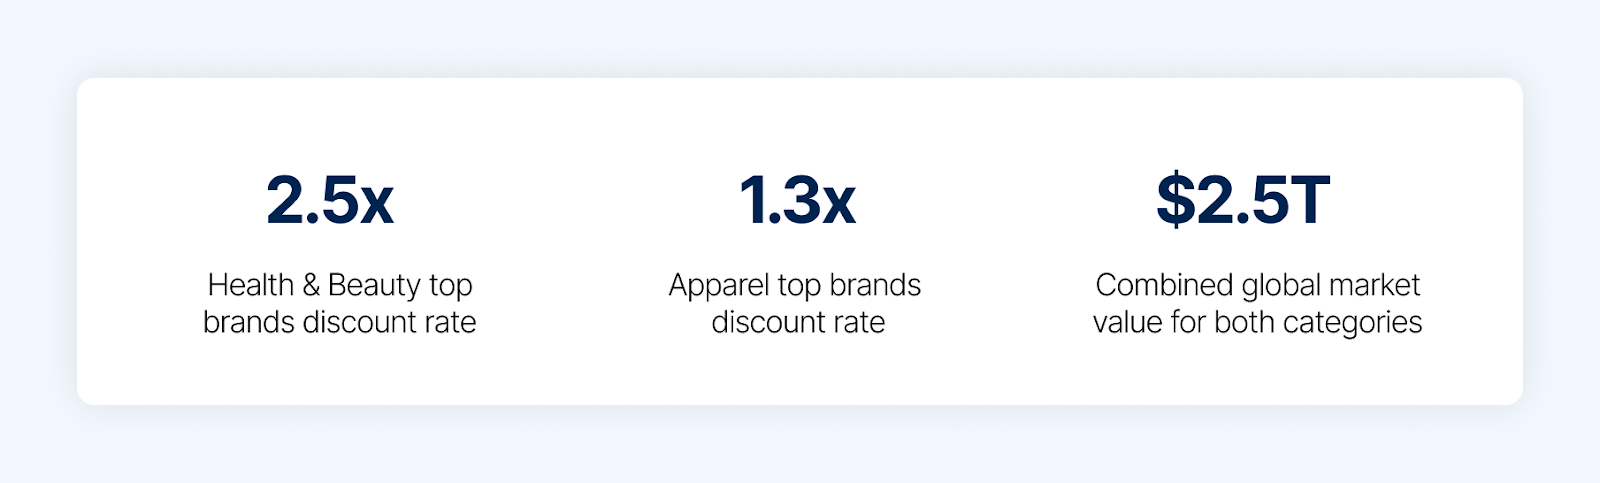
These aren’t just some of the largest categories — Apparel and Health & Beauty represent over $2.5 trillion in global market value, with Apparel dominating at $1.84 trillion and Health & Beauty coming in second at $677 billion. In the past year, Triple Whale Apparel brands spent $4.1 billion on ads, and Health & Beauty brands spent $4.4 billion. These two categories combined account for over 50% of total ad spend across all categories.
Not only are these categories massive, they’re still growing: Apparel at 2.64% Compound Annual Growth Rate (GACR) and Health & Beauty at 3.37% CAGR. Online fashion sales have captured nearly 48% of total retail, and the Health & Beauty market is now pulling 30% of revenue from ecommerce platforms.
While fast fashion brands (like SHEIN) continue to gain market share through aggressive pricing and speed-to-market, there is still a premium Apparel segment growing at 5.12% CAGR, despite mass market fashion dominating 89.12% of sales. Similarly, Health & Beauty’s premium segment is also growing faster (6.45% CAGR) than the mass market despite holding only a portion of market share. In both verticals, the growth in premium segments suggests that consumers will pay for quality when the value proposition is clear.
These parallel trends in digital acceleration and a growth in premium categories despite value pressure create an environment where promotional strategy becomes a key competitive differentiator rather than a simple tactical lever.
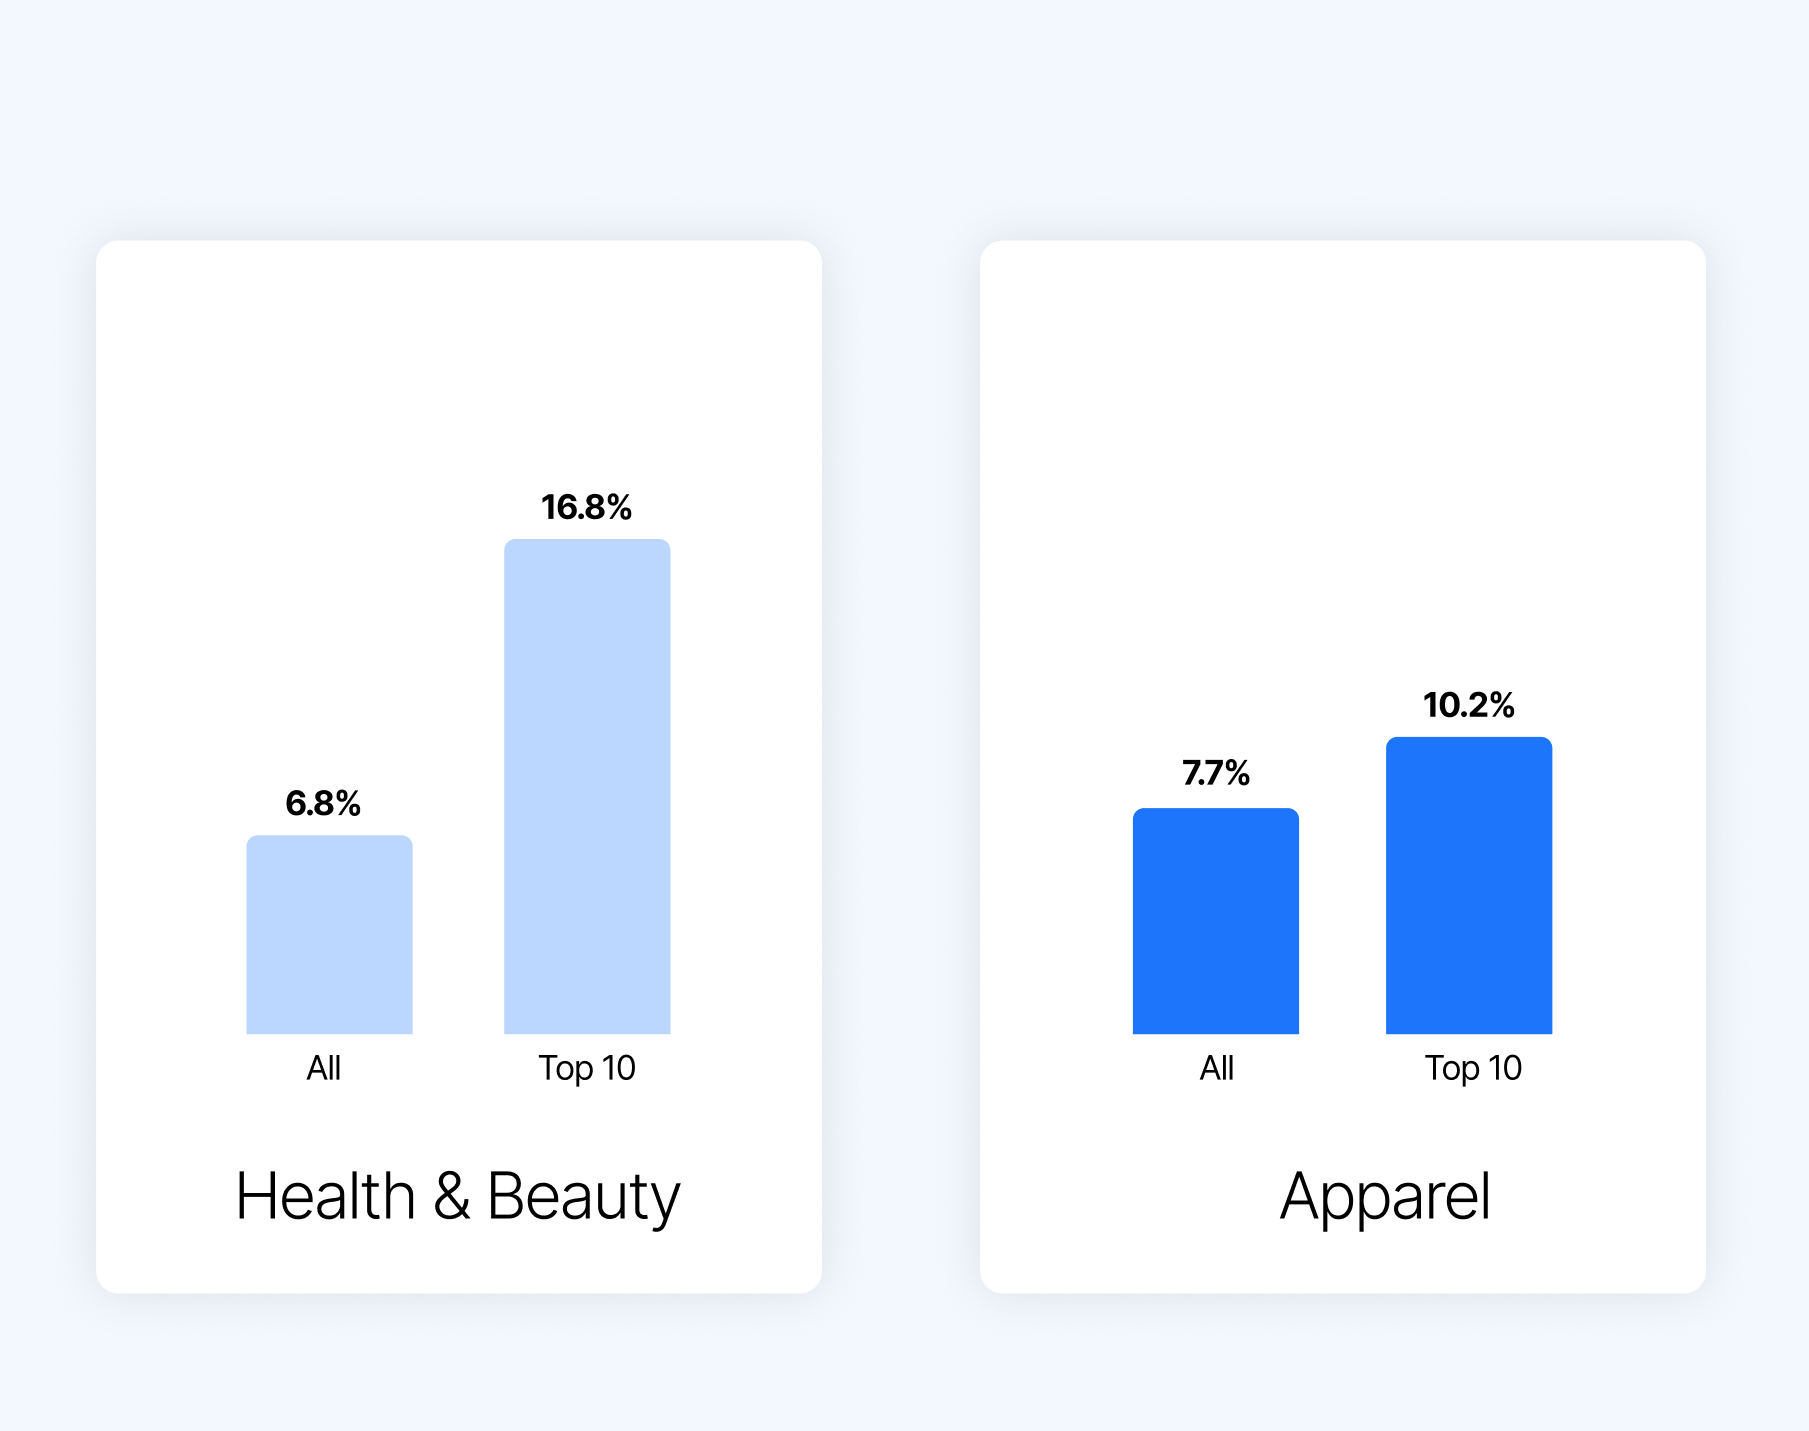
When we examined discount rates in Particl’s dataset across 105 weeks of data from October 2023 to September 2025, a clear pattern emerged. The market average discount rate for Health & Beauty sits at 6.8% — a relatively conservative level that reflects the industry’s traditional emphasis on efficacy, ingredients, and brand trust over price competition.
The top 10 brands, however, operate with dramatically different promotional intensity. Their average discount rate is 16.8%, representing a promotional strategy that’s 2.5x more aggressive than the market norm.
These aren’t occasional flash sales or clearance events — this is sustained promotional activity from brands at the top of the category.
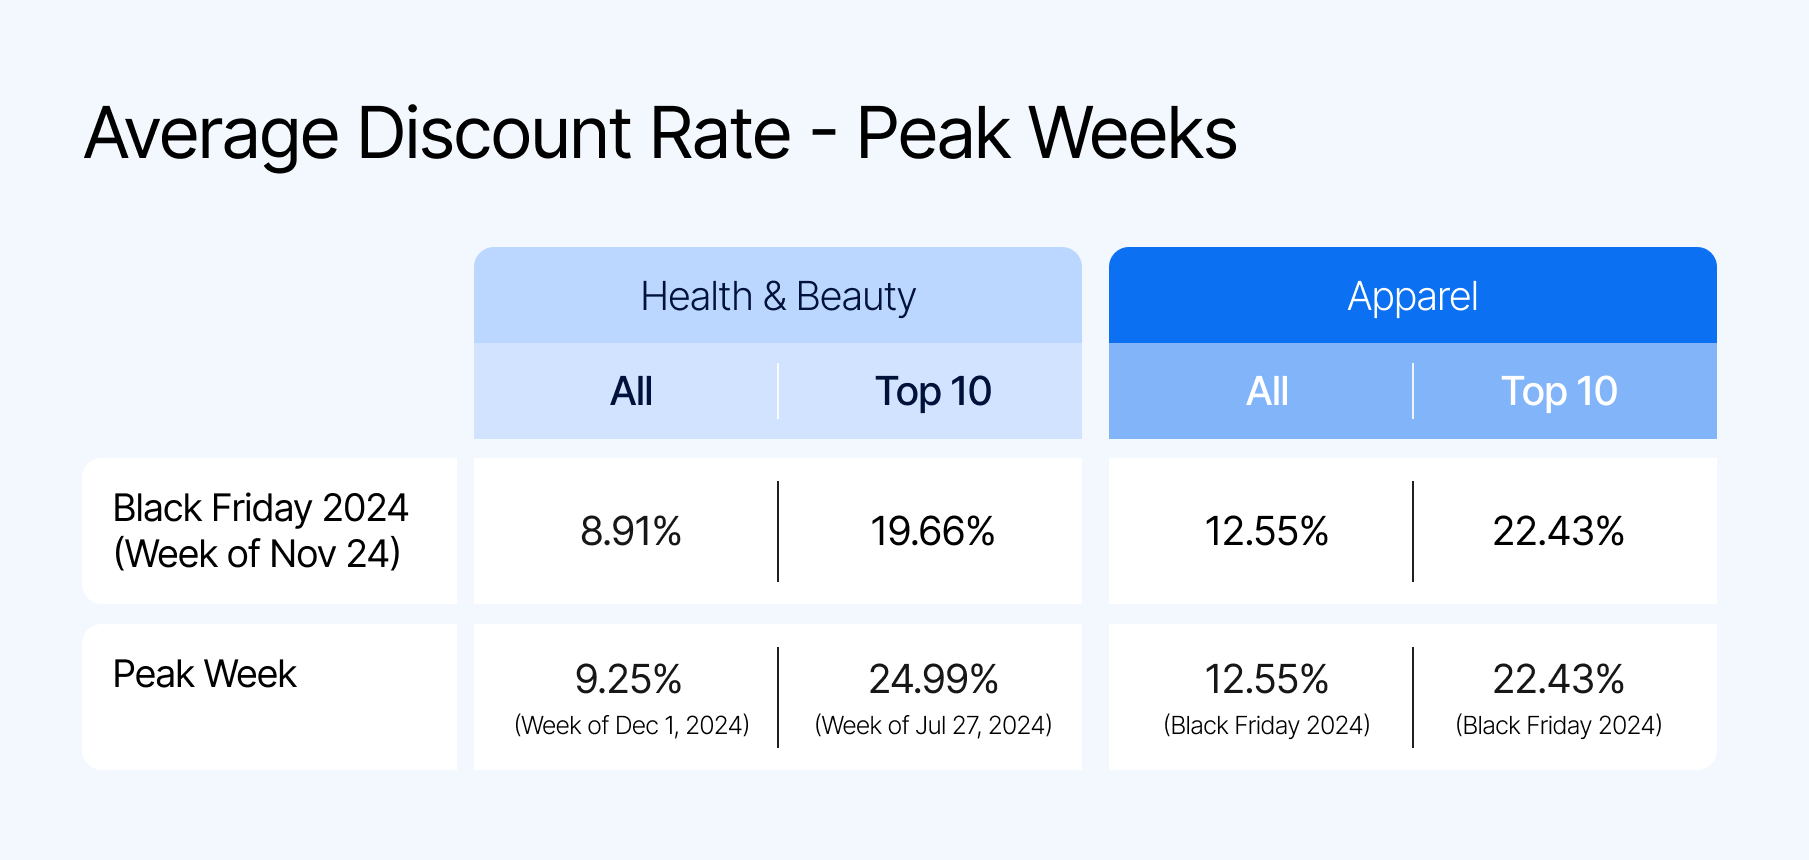
From September through December 2024 — a key shopping moment for brands across verticals — top Health & Beauty brands ramped promotional intensity to unprecedented levels. Discount rates climbed from 16.7% in early September to peaks of 22.4% by late December — nearly triple the market average during the same period. This represented a sustained and strategic push that continued into early 2025, with discount rates that remained in the 20-23% range throughout March.
While conventional advice often emphasizes pricing discipline, the most successful Health & Beauty brands in this dataset maintain market leadership while discounting at rates that would seem aggressive for most brands.
The Apparel market shows a similar pattern, though less extreme. Across the market sample at large, the discount rate is 7.7%, slightly higher than Health & Beauty, reflecting Apparel’s more competitive pricing dynamics and seasonal pressure.
Top 10 Apparel brands discount at 10.2%, representing 1.3x more promotional intensity than the market average. While the gap is smaller than Health & Beauty, the pattern holds: category leaders are more promotionally aggressive, not less.
For most of 2024, the top 10 Apparel brands maintained discount rates in the 5-9% range — often lower than or equal to the market at large.
Then came Black Friday 2024:
This represents the inverse of Health & Beauty’s sustained intensity. Top Apparel brands create impact through contrast: months of pricing discipline make their Black Friday promotions feel like genuine events rather than continuous noise.
Separate from promotional strategy, we analyzed 105 weeks of transaction data across more than 20,000 Triple Whale brands to reveal how customers shop in these categories, and the patterns differ dramatically.
These differences reflect distinct purchase behaviors: Beauty customers make frequent, moderate-value replenishment purchases, while Apparel customers make less frequent, higher-value purchases.
Health & Beauty: Stable with November Holiday Peak
Monthly patterns show consistent performance, with most months clustered tightly in the $58-60 range, with minimal seasonal variation. The standout exception is November, which averages $62.09 — representing a 4.2% premium over the annual average.
The top-performing weeks all occur in November, with the peak week (November 20, 2023) reaching $66.97 — the highest AOV across the entire 105-week period. All five top weeks fall within a 2-week November window, suggesting concentrated holiday gift-giving behavior rather than sustained seasonal patterns.
The lowest AOV weeks are clustered in late winter and early spring (February through April), with the bottom week (April 1, 2024) at $56.32. This valley represents just an 8.4% difference from the annual average — remarkably stable compared to Apparel’s volatility.
Apparel: Dramatic October-November Surge
Apparel shows far more pronounced seasonal behavior. October and November stand out dramatically, averaging $87.32 and $84.73, respectively — representing 4.8% and 1.7% premiums over the baseline.
The top performing weeks cluster entirely in October 2023, with the peak week (October 23, 2023) reaching $92.24 — a 10.7% premium over the annual average. All five top weeks occur within a single month, showing how concentrated high-value purchasing can be in fashion retail.
The lowest transaction values occur in December 2024, with the valley week (December 9, 2024) at $79.00. This represents a 13.9% range from peak to valley — significantly more volatile than Health & Beauty’s 8.4% range.
Interestingly, December shows weaker performance ($82.77) than October-November, suggesting that holiday apparel shopping concentrates in the fall months rather than December itself. This could reflect gift-giving patterns where clothing is purchased earlier, or customers focusing December spending on other categories.
The data reveals fundamentally different customer behaviors.
Understanding these natural transaction rhythms provides context for interpreting promotional strategies. Categories with stable AOV patterns like Health & Beauty offer different strategic opportunities than more volatile categories like Apparel where transaction values swing significantly based on timing and occasion.
With top brands discounting heavily, 1.3x-2.5x higher than the market at large for Health & Beauty and Apparel, respectively, these brands clearly have mastered how to maintain market leadership without eroding AOV.
When we investigate some potential ways market leaders can sustain such aggressive strategies, five key strategies emerge:
Instead of “20% off everything”, top brands structure offers that build basket size: “Spend $75, get $20 off” or “Buy 3, get 25% off”. This architecture ensures discounts reward higher spending rather than simply reducing prices on items customers would buy anyway.
How to implement:
If your average order value is $60, set thresholds at $75 or $90. Tiered discounts tend to motivate customers to reach the next level, so a $60 customer adding a $20 item to save $15 increases your revenue by $5 while making the customer feel like they got a good deal.
Use Moby to find your optimal AOV threshold:
Example query: "Show me AOV distribution in $10 buckets for the last 90 days, and calculate what % of orders fall between $60-$75.”
Nine out of ten customers cite free shipping as their greatest incentive, but the threshold matters. It should live 15-20% higher than your current AOV to drive incremental purchases.
How to implement:
If your AOV is $60, set the free shipping threshold at $75. For the $60 customer, that $15 gap represents two or three additional items in Beauty (lipstick, travel-sized product) or one accessory item in Apparel. They add products to avoid an $8 shipping fee, and you gain $15 in revenue.
Use Moby to forecast impact of free shipping threshold changes:
Example query: "If we move free shipping from $50 to $75, how many customers would add items vs abandon?"
Cross-selling can boost sales by 20% and profits by 30%, because bundles combine discounted traffic drivers with the full-margin companions.
How to implement:
Bundle a high-margin product with promotional drivers — so if you’re discounting a popular $40 serum at 20% off ($32), bundle it with a $25 toner at full price for a $55 total. Customer saves versus buying separately ($57 → $55) while you maintain blended margin on top of moving two units.
Use the Bundle Analysis Dashboard to find high-margin products to bundle with popular discounted items, ensuring you protect margins while increasing units per transaction.
Rather than maintaining 8% discount rates year-round, top Apparel brands hold at 5-7% for 10 months, then surge to 22% discount rates for Black Friday. This creates events rather than noise.
How to implement:
Identify your 3-4 highest-intent shopping periods (category-dependent: November for gifting, back-to-school, seasonal transitions). Concentrate 60-70% of your annual promotional budget during these windows, and use non-discount incentives like early access, exclusive products, and loyalty points during the off-peak periods.
Use Moby to determine current promotional intensity:
Example Query: "Show me monthly revenue, total discount amount, number of orders with discounts, and calculate discount rate (discount amount / revenue) for the last 12 months. Group by month and order chronologically."
Not every customer needs the same offer, and consumers often will make a more expensive purchase than planned due to personalized experiences.
How to implement:
Specifically segment the following customers:
Use the Customer Lifetime Value Analysis Agent to identify high-LTV repeat customers, new customers, and lapsed customers to target with specific promotions.
Promotional mastery is the key to winning for both Health & Beauty and Apparel, and the top brands in each category have it on lock.
Unfortunately, for smaller players in the same field, the performance gap between leaders and the rest of the market is widening. As these categories continue their digital transformation, the brands that master sophisticated promotional strategies will capture disproportionate growth.
The question for emerging brands isn’t whether they should discount but whether they’re building the capabilities that allow them to discount aggressively without destroying long-term value.
For brands aspiring to elite status in these trillion-dollar categories, the path forward requires investment in strategic infrastructure to make promotional intensity a competitive weapon rather than a margin destroyer. The top performers have already provided the playbook.
Methodology
Data from Particl includes discount rate tracking across 304 Health & Beauty brands and 1,439 Apparel brands over a 105-week period from October 2023 through September 2025. “Top 10 brands” were identified based on market presence and revenue scale in their respective categories.
Data from Triple Whale includes median AOV for 8,668 Health & Beauty brands and 12,045 Apparel brands over the same 105-week period from October 2023 through September 2025.
Discounting is an art.
There’s a fine balance between running heavy discounts and keeping products at their original price, which yields the highest profit margin. If you discount too heavily and too often, you risk training your customers to expect sales. And if you don’t discount frequently enough, you might miss out on sales from potential new customers attracted by your offer.
We partnered with Particl to analyze how Apparel and Health & Beauty brands structure their discount levels, as well as how average order value (AOV) changes over time for a 105-week period from October 2023 through September 2025. This analysis revealed that the top brands in each vertical approached discounting in a much different way than the market at large.
The top 10 Apparel brands discounted at a rate 1.3x higher than market average, while the top 10 Health & Beauty brands discounted at a rate 2.5x higher.
This raises an interesting question: Are the top brands succeeding because of their aggressive discounting, or can they simply afford to discount more heavily because they’re already market leaders? The reality likely involves both dynamics, but understanding what separates their approach from the market’s steady, moderate discounting reveals crucial insights about competitive positioning in these massive categories.
We also analyzed transaction data from over 20,000 brands to understand seasonal shopping patterns and the impact on AOV.
Where Health & Beauty basket sizes stay consistent year-round, Apparel customers tend to make larger, less frequent purchases tied to specific occasions or needs.
In this article, we’ll take a deep dive into discount strategies and AOV to understand what top performers do differently than brands in the broader market, and why these strategies can help brands succeed.
These aren’t just some of the largest categories — Apparel and Health & Beauty represent over $2.5 trillion in global market value, with Apparel dominating at $1.84 trillion and Health & Beauty coming in second at $677 billion. In the past year, Triple Whale Apparel brands spent $4.1 billion on ads, and Health & Beauty brands spent $4.4 billion. These two categories combined account for over 50% of total ad spend across all categories.
Not only are these categories massive, they’re still growing: Apparel at 2.64% Compound Annual Growth Rate (GACR) and Health & Beauty at 3.37% CAGR. Online fashion sales have captured nearly 48% of total retail, and the Health & Beauty market is now pulling 30% of revenue from ecommerce platforms.
While fast fashion brands (like SHEIN) continue to gain market share through aggressive pricing and speed-to-market, there is still a premium Apparel segment growing at 5.12% CAGR, despite mass market fashion dominating 89.12% of sales. Similarly, Health & Beauty’s premium segment is also growing faster (6.45% CAGR) than the mass market despite holding only a portion of market share. In both verticals, the growth in premium segments suggests that consumers will pay for quality when the value proposition is clear.
These parallel trends in digital acceleration and a growth in premium categories despite value pressure create an environment where promotional strategy becomes a key competitive differentiator rather than a simple tactical lever.
When we examined discount rates in Particl’s dataset across 105 weeks of data from October 2023 to September 2025, a clear pattern emerged. The market average discount rate for Health & Beauty sits at 6.8% — a relatively conservative level that reflects the industry’s traditional emphasis on efficacy, ingredients, and brand trust over price competition.
The top 10 brands, however, operate with dramatically different promotional intensity. Their average discount rate is 16.8%, representing a promotional strategy that’s 2.5x more aggressive than the market norm.
These aren’t occasional flash sales or clearance events — this is sustained promotional activity from brands at the top of the category.
From September through December 2024 — a key shopping moment for brands across verticals — top Health & Beauty brands ramped promotional intensity to unprecedented levels. Discount rates climbed from 16.7% in early September to peaks of 22.4% by late December — nearly triple the market average during the same period. This represented a sustained and strategic push that continued into early 2025, with discount rates that remained in the 20-23% range throughout March.
While conventional advice often emphasizes pricing discipline, the most successful Health & Beauty brands in this dataset maintain market leadership while discounting at rates that would seem aggressive for most brands.
The Apparel market shows a similar pattern, though less extreme. Across the market sample at large, the discount rate is 7.7%, slightly higher than Health & Beauty, reflecting Apparel’s more competitive pricing dynamics and seasonal pressure.
Top 10 Apparel brands discount at 10.2%, representing 1.3x more promotional intensity than the market average. While the gap is smaller than Health & Beauty, the pattern holds: category leaders are more promotionally aggressive, not less.
For most of 2024, the top 10 Apparel brands maintained discount rates in the 5-9% range — often lower than or equal to the market at large.
Then came Black Friday 2024:
This represents the inverse of Health & Beauty’s sustained intensity. Top Apparel brands create impact through contrast: months of pricing discipline make their Black Friday promotions feel like genuine events rather than continuous noise.
Separate from promotional strategy, we analyzed 105 weeks of transaction data across more than 20,000 Triple Whale brands to reveal how customers shop in these categories, and the patterns differ dramatically.
These differences reflect distinct purchase behaviors: Beauty customers make frequent, moderate-value replenishment purchases, while Apparel customers make less frequent, higher-value purchases.
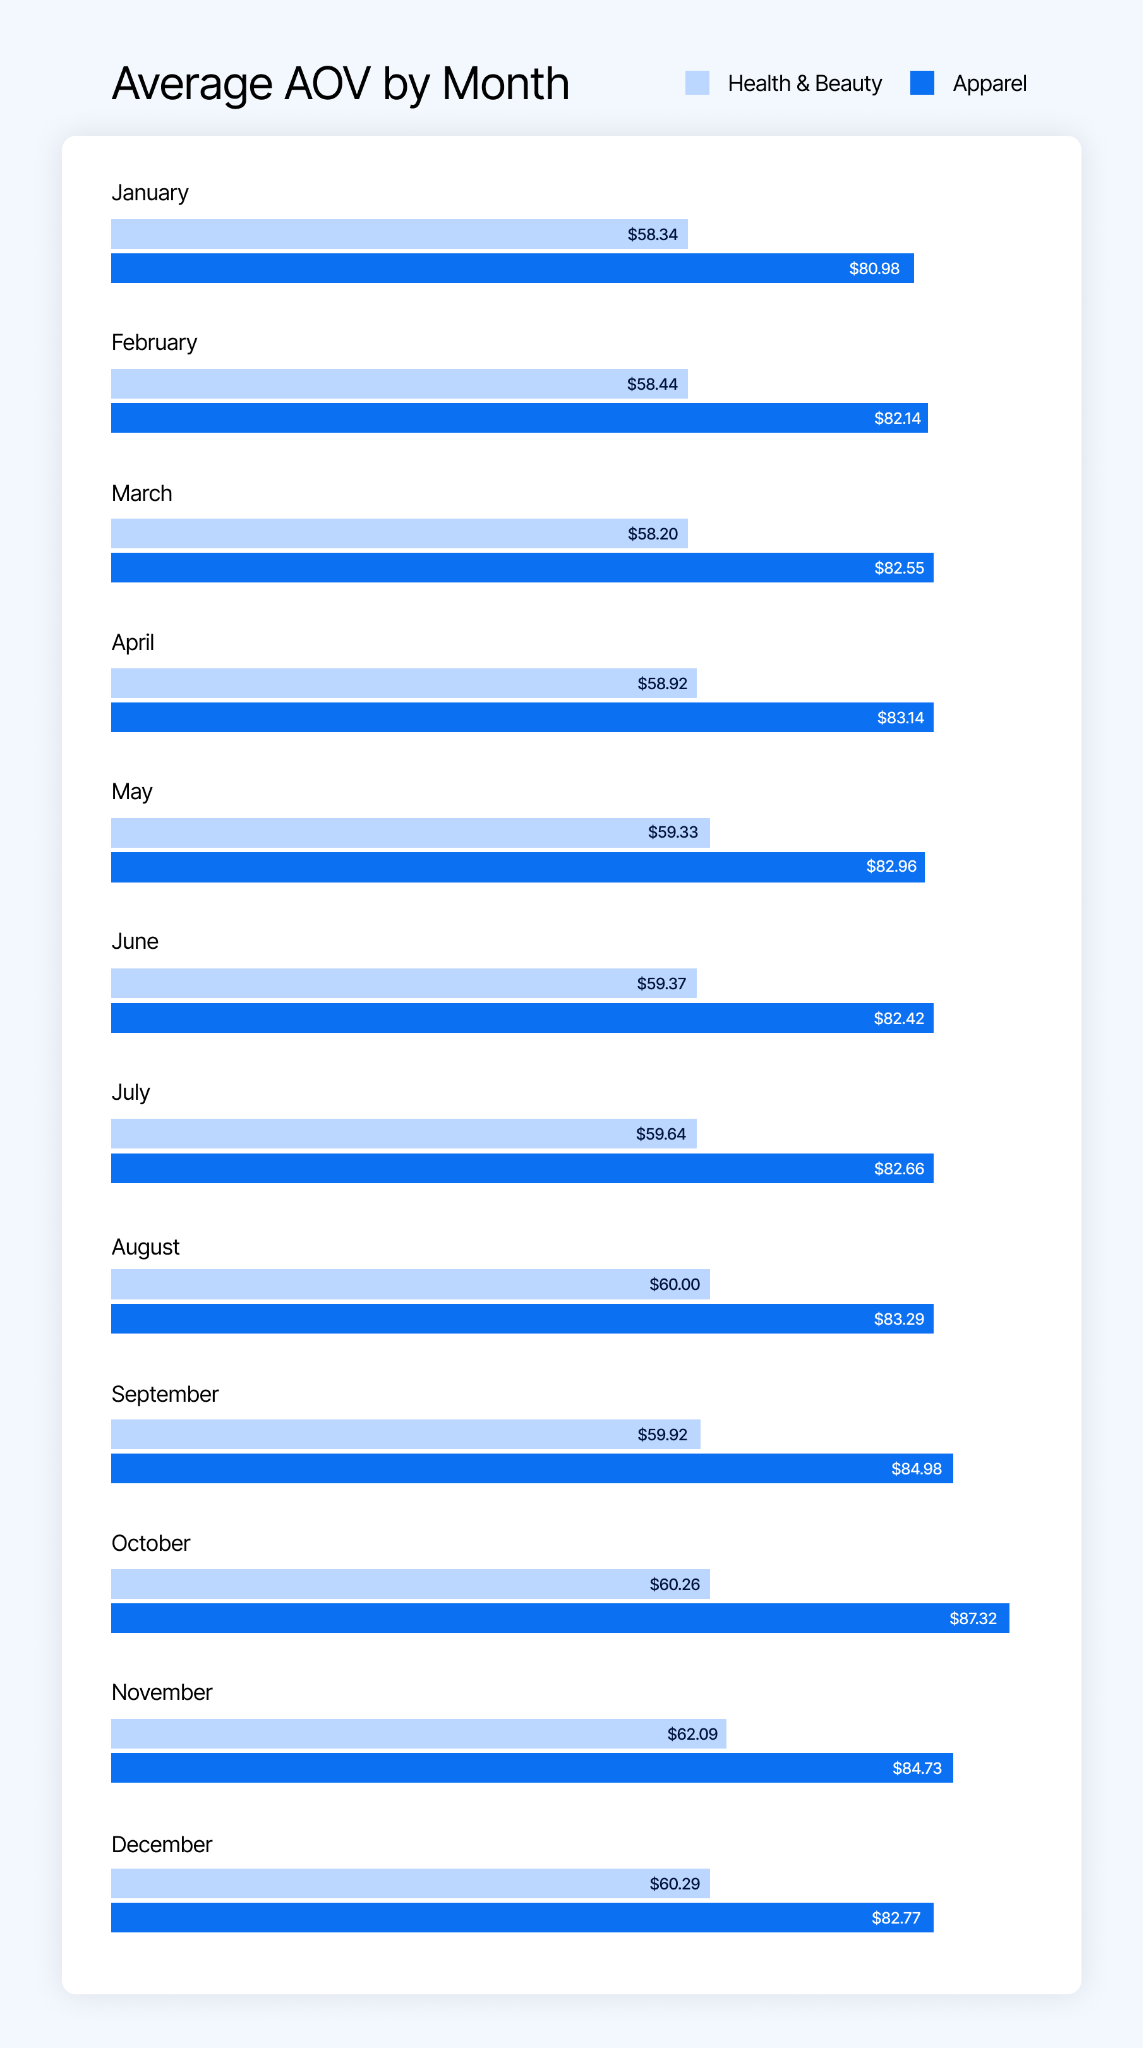
Health & Beauty: Stable with November Holiday Peak
Monthly patterns show consistent performance, with most months clustered tightly in the $58-60 range, with minimal seasonal variation. The standout exception is November, which averages $62.09 — representing a 4.2% premium over the annual average.
The top-performing weeks all occur in November, with the peak week (November 20, 2023) reaching $66.97 — the highest AOV across the entire 105-week period. All five top weeks fall within a 2-week November window, suggesting concentrated holiday gift-giving behavior rather than sustained seasonal patterns.
The lowest AOV weeks are clustered in late winter and early spring (February through April), with the bottom week (April 1, 2024) at $56.32. This valley represents just an 8.4% difference from the annual average — remarkably stable compared to Apparel’s volatility.
Apparel: Dramatic October-November Surge
Apparel shows far more pronounced seasonal behavior. October and November stand out dramatically, averaging $87.32 and $84.73, respectively — representing 4.8% and 1.7% premiums over the baseline.
The top performing weeks cluster entirely in October 2023, with the peak week (October 23, 2023) reaching $92.24 — a 10.7% premium over the annual average. All five top weeks occur within a single month, showing how concentrated high-value purchasing can be in fashion retail.
The lowest transaction values occur in December 2024, with the valley week (December 9, 2024) at $79.00. This represents a 13.9% range from peak to valley — significantly more volatile than Health & Beauty’s 8.4% range.
Interestingly, December shows weaker performance ($82.77) than October-November, suggesting that holiday apparel shopping concentrates in the fall months rather than December itself. This could reflect gift-giving patterns where clothing is purchased earlier, or customers focusing December spending on other categories.
The data reveals fundamentally different customer behaviors.
Understanding these natural transaction rhythms provides context for interpreting promotional strategies. Categories with stable AOV patterns like Health & Beauty offer different strategic opportunities than more volatile categories like Apparel where transaction values swing significantly based on timing and occasion.
With top brands discounting heavily, 1.3x-2.5x higher than the market at large for Health & Beauty and Apparel, respectively, these brands clearly have mastered how to maintain market leadership without eroding AOV.
When we investigate some potential ways market leaders can sustain such aggressive strategies, five key strategies emerge:
Instead of “20% off everything”, top brands structure offers that build basket size: “Spend $75, get $20 off” or “Buy 3, get 25% off”. This architecture ensures discounts reward higher spending rather than simply reducing prices on items customers would buy anyway.
How to implement:
If your average order value is $60, set thresholds at $75 or $90. Tiered discounts tend to motivate customers to reach the next level, so a $60 customer adding a $20 item to save $15 increases your revenue by $5 while making the customer feel like they got a good deal.
Use Moby to find your optimal AOV threshold:
Example query: "Show me AOV distribution in $10 buckets for the last 90 days, and calculate what % of orders fall between $60-$75.”
Nine out of ten customers cite free shipping as their greatest incentive, but the threshold matters. It should live 15-20% higher than your current AOV to drive incremental purchases.
How to implement:
If your AOV is $60, set the free shipping threshold at $75. For the $60 customer, that $15 gap represents two or three additional items in Beauty (lipstick, travel-sized product) or one accessory item in Apparel. They add products to avoid an $8 shipping fee, and you gain $15 in revenue.
Use Moby to forecast impact of free shipping threshold changes:
Example query: "If we move free shipping from $50 to $75, how many customers would add items vs abandon?"
Cross-selling can boost sales by 20% and profits by 30%, because bundles combine discounted traffic drivers with the full-margin companions.
How to implement:
Bundle a high-margin product with promotional drivers — so if you’re discounting a popular $40 serum at 20% off ($32), bundle it with a $25 toner at full price for a $55 total. Customer saves versus buying separately ($57 → $55) while you maintain blended margin on top of moving two units.
Use the Bundle Analysis Dashboard to find high-margin products to bundle with popular discounted items, ensuring you protect margins while increasing units per transaction.
Rather than maintaining 8% discount rates year-round, top Apparel brands hold at 5-7% for 10 months, then surge to 22% discount rates for Black Friday. This creates events rather than noise.
How to implement:
Identify your 3-4 highest-intent shopping periods (category-dependent: November for gifting, back-to-school, seasonal transitions). Concentrate 60-70% of your annual promotional budget during these windows, and use non-discount incentives like early access, exclusive products, and loyalty points during the off-peak periods.
Use Moby to determine current promotional intensity:
Example Query: "Show me monthly revenue, total discount amount, number of orders with discounts, and calculate discount rate (discount amount / revenue) for the last 12 months. Group by month and order chronologically."
Not every customer needs the same offer, and consumers often will make a more expensive purchase than planned due to personalized experiences.
How to implement:
Specifically segment the following customers:
Use the Customer Lifetime Value Analysis Agent to identify high-LTV repeat customers, new customers, and lapsed customers to target with specific promotions.
Promotional mastery is the key to winning for both Health & Beauty and Apparel, and the top brands in each category have it on lock.
Unfortunately, for smaller players in the same field, the performance gap between leaders and the rest of the market is widening. As these categories continue their digital transformation, the brands that master sophisticated promotional strategies will capture disproportionate growth.
The question for emerging brands isn’t whether they should discount but whether they’re building the capabilities that allow them to discount aggressively without destroying long-term value.
For brands aspiring to elite status in these trillion-dollar categories, the path forward requires investment in strategic infrastructure to make promotional intensity a competitive weapon rather than a margin destroyer. The top performers have already provided the playbook.
Methodology
Data from Particl includes discount rate tracking across 304 Health & Beauty brands and 1,439 Apparel brands over a 105-week period from October 2023 through September 2025. “Top 10 brands” were identified based on market presence and revenue scale in their respective categories.
Data from Triple Whale includes median AOV for 8,668 Health & Beauty brands and 12,045 Apparel brands over the same 105-week period from October 2023 through September 2025.


Body Copy: The following benchmarks compare advertising metrics from April 1-17 to the previous period. Considering President Trump first unveiled his tariffs on April 2, the timing corresponds with potential changes in advertising behavior among ecommerce brands (though it isn’t necessarily correlated).


.webp)

.webp)


.png)


.png)
