


It’s essential to track ecommerce metrics in order to make informed decisions about your online business. Your success depends on knowing what to measure, when to measure it, and monitoring how your numbers fluctuate over time.
This comprehensive guide will introduce you to all the ecommerce performance metrics to consider, help you understand how to measure ecommerce success, and highlight ways to improve your performance.
There are a lot of different ecommerce metrics to track, and it can be tricky to know which ones are most important for your brand. Each metric is unique in that it provides a specific measurement or data point that gives you some insight into the performance of your ecommerce store.
Metrics are different from KPIs. Key performance indicators are benchmarks you establish to help you measure how well you’re doing against your goals and objectives. Identifying the ecommerce KPIs to track is crucial for an online store’s success.
For example, a metric you track might be site traffic. You’ll get this number at a specific point in time and it will tell you how your traffic is performing. But your traffic-related KPI may be to increase by 70% over the next year.
A metric is a snapshot in time; a KPI is an outcome to strive for. Without KPIs, metrics simply give you information, not clues as to what kind of action to take next. KPIs are what guide you when it comes to optimizing, scaling, and improving performance.
There are various metrics you can decide to track based on your brand and goals (more on that below). But these are the most important ecommerce metrics everyone should keep an eye on.
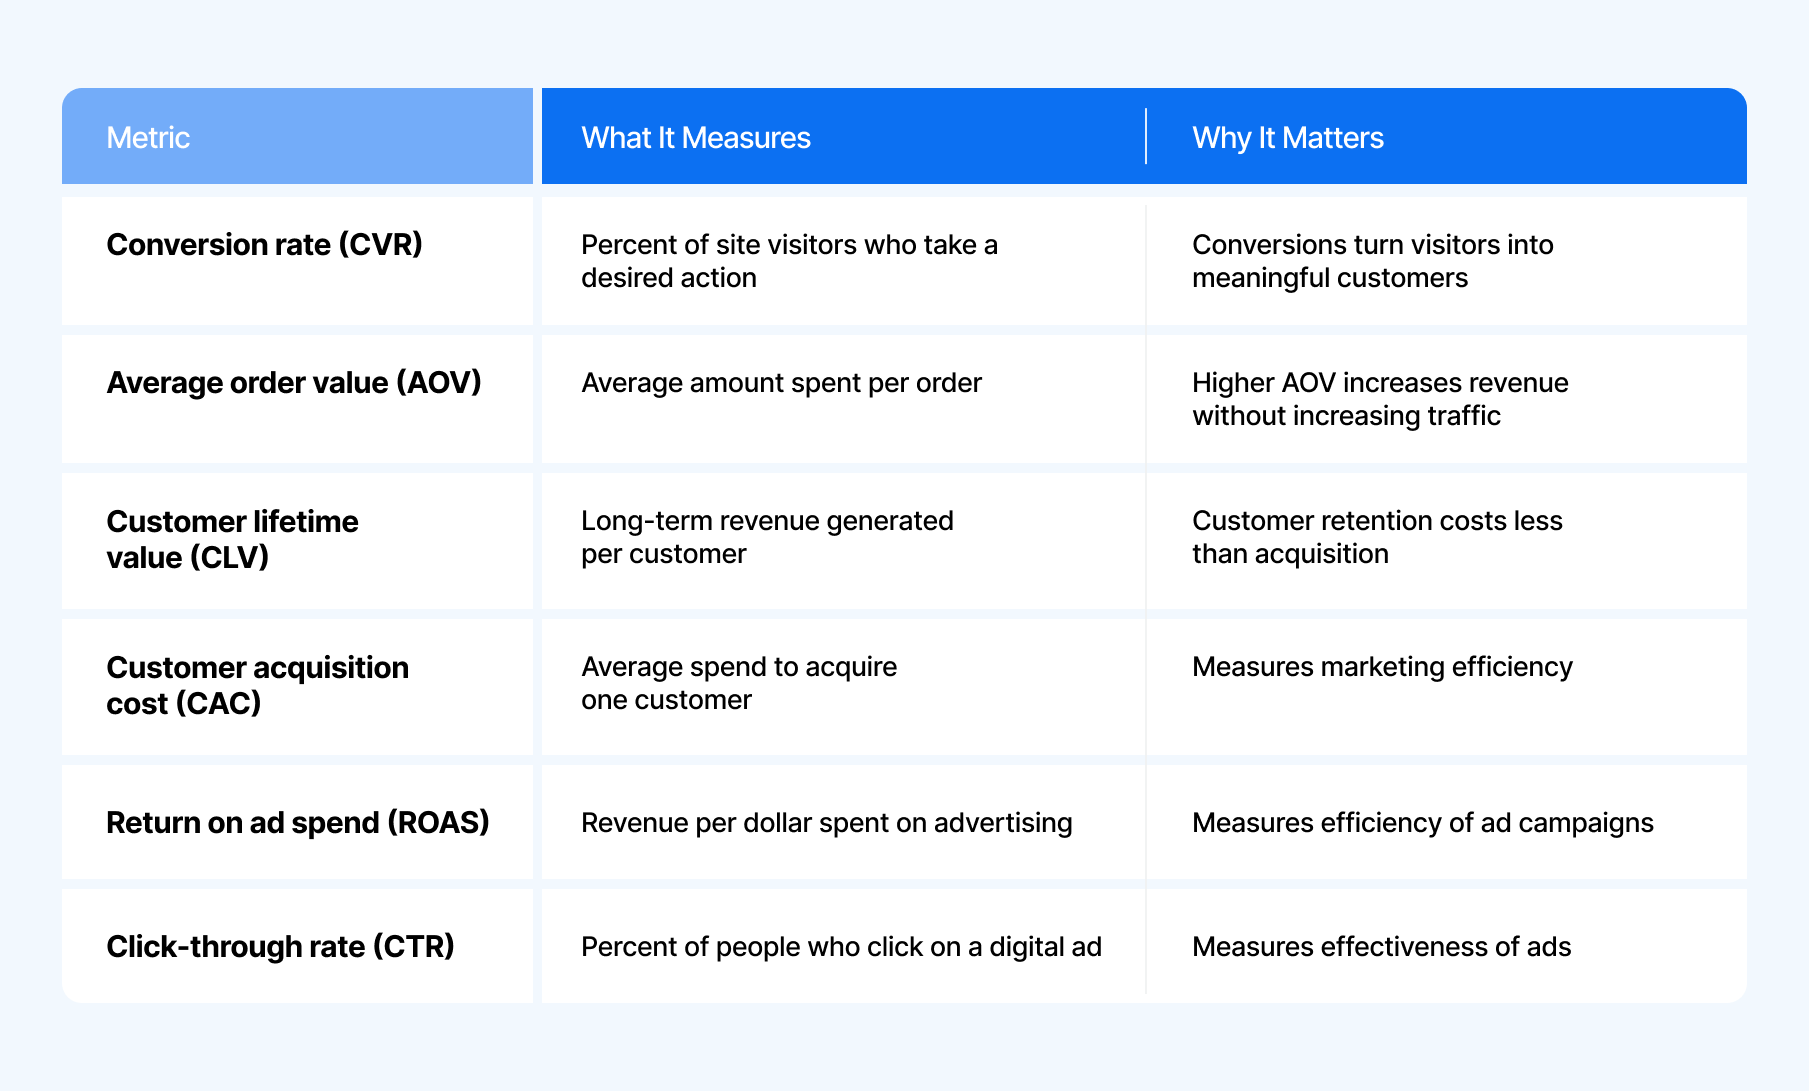
The CVR marketing metric calculates the percentage of your site visitors who take a desired action, like making a purchase, signing up for a newsletter, or filling out a form.
A high conversion rate indicates your advertising and website are effectively turning visitors into customers or leads. A low conversion rate may indicate that your site needs improvement with conversion rate optimization.
There are a number of factors that can affect conversion rate, such as the design of your site, the clarity of your calls to action, and the prices of your products. By regularly monitoring your conversion rate, you can identify areas where your site could be improved in order to drive more conversions.
Your CVR directly affects the revenue you generate from advertising efforts. A higher CVR means more of the people interacting with your brand are taking meaningful actions that contribute to your bottom line.
The average CVR varies by industry, but a good CVR to aim for is above 2%.
Average order value is how much money, on average, a customer spends when placing an order with your business. This metric evaluates your customers’ purchasing behavior and your business’s overall health.
A higher AOV means customers are spending more money per transaction, which can help you generate more revenue and achieve a better return on your advertising investment.
Tracking AOV is important because it can help you spot opportunities for growth. For example, if your total sales are increasing but your AOV isn’t, your new customers aren’t adding upsells to their cart. You might need to focus on improving your cross-selling or upselling offerings.
On the other hand, if your AOV is increasing but your total sales are flat, you may be losing market share even though new customers are spending more. That might mean it’s time to invest in customer acquisition or focus on driving repeat purchases.
Ultimately, monitoring AOV is essential for any ecommerce business that wants to stay competitive and grow over time.
Any business that wants to stay afloat needs to keep track of its customer lifetime value (CLV or sometimes LTV or CLTV). This metric tells you how much revenue a customer is likely to generate over the course of their relationship with your company.
For ecommerce businesses, tracking CLV is especially important. That's because the cost of acquiring new customers is often higher than the cost of retaining existing ones. By understanding your CLV, you can make informed decisions about where to allocate your marketing budget and which customers are worth investing in.
Tracking CLV can also help you identify trends and patterns that can be used to improve your customer experience.
It’s important to know where your customers are coming from and how much it costs to acquire them. This is known as your customer acquisition cost (CAC).
By tracking CAC, you can make informed decisions about where to allocate your resources in order to attract new customers. For example, if you’re spending more on advertising than you’re making in sales, it might be time to reevaluate your strategy.
On the other hand, if a particular marketing campaign is resulting in a high number of new customers at a low cost, it may be worth investing more in that area. Tracking CAC can also help you identify areas where you may be overspending or underperforming.
With return on ad spend (ROAS), you can gauge how efficient an ad campaign is, which will allow you to make adjustments to the campaign accordingly. You can monitor the return on your ad spend to ensure your efforts drive revenue growth.
ROAS tells you how much money you’re making for every dollar invested in advertising. It helps you understand the profitability of your marketing efforts and make informed decisions about budget allocation and optimization.
A higher ROAS indicates your advertising is more effective at driving revenue, while a lower ROAS suggests you may need to optimize your campaigns to improve profitability.
Track your ROAS for every campaign you run; this allows you to determine which campaigns are successful and which aren’t worth the money.
That’s what makes ROAS such an important metric to track: It tells you whether your advertising budget is being used effectively. This, in turn, can help you to maximize your profits and grow your business.
Click-through rate (CTR) measures the percentage of people who click on your ad after seeing it. It indicates how engaging and relevant your ad is to your target audience.
A high CTR suggests your ad is effectively capturing attention and encouraging people to take action, while a low CTR may indicate your ad isn’t resonating with your audience. What’s considered a “good” CTR varies by industry and platform, but the average for display ads is less than 1%, according to marketing education platform CXL.
Those were the top ecommerce metrics—but there are lots of other basic ecommerce metrics you might want to consider calculating and tracking, too.
We’ve broken them down by different KPIs for ecommerce so you can pick and choose from different categories of information.
Acquisition and traffic numbers are important ecommerce metrics because they tell you more about how many visitors are coming to your website (or app). If you’re going to convert visitors into customers, you have to get their attention first!
Although website traffic doesn’t directly correlate with revenue or profit, it’s an important metric to check to ensure your business is on the right trajectory. You can track traffic through most website analytics platforms.
Getting quality traffic with high buyer-intent should always be the goal of every ecommerce store. Don’t sacrifice a small amount of high-quality traffic for a large amount of lower-quality traffic that doesn’t convert. The overall number doesn’t need to be huge, but you should strive to continuously grow your high-quality website traffic.
Regularly monitoring traffic will also allow you to spot and address any potential issues with your site that contribute to a negative customer experience, such as broken links or pages that take too long to load. In today's competitive online landscape, optimizing your customer experience is more important than ever.
Impressions are simply the total number of times your ad appears in front of a user. It doesn’t have anything to do with interactions or clicks, but users can’t interact with your business if they don’t see it.
Impressions is a baseline metric that signifies your potential for reach and visibility and contributes to exposure and brand awareness. You can track it using many different analytics tools.
Reach is a similar metric of ad exposure but slightly different from impressions. Your reach measures how many different users have seen your ad. (Impressions can measure multiple views by the same user.)
A high reach means your ads are being seen by a wider audience, which is a good thing when it comes to acquiring new customers.
Not to be confused with customer engagement, engagement aims to measure how users are interacting with your content, by tallying up interactions such as likes, comments, shares, and time spent on page.
Generally speaking, higher engagement is a sign of brand loyalty and connection, which can drive conversions and profitability over time.
Bounce rate is another important website traffic metric that tells you how many website visitors leave your site after only viewing one page. That means you want your bounce rate to be low.
Cost per click measures how much it costs to generate a single click from an online ad. Tracking CPC is essential for understanding the return on your marketing efforts.
By understanding your CPC, you can adjust your ad spend accordingly and focus on those platforms and audiences that are more likely to generate conversions. It’s a popular pricing model for search engine and social media advertising.
To calculate CPC, divide the total cost of an ad campaign by the number of clicks it received. A lower CPC means you’re paying less for each click, which can help you stretch your advertising budget further. A sudden increase in CPC could be a sign your ad is saturated or you’re marketing to the wrong audience.
That said, you want the clicks you’re paying for to translate into meaningful actions like purchases. To that end, you might accept a higher CPC if serving your ads to an audience that’s more expensive to reach translates into more conversions.
Cost per thousand impressions or CPM is a measure of the cost of 1,000 ad impressions. An ad impression is counted each time your ad is displayed, regardless of whether a user clicks it or not.
CPM is commonly used in online display advertising, where you pay based on the number of times your ad is shown to potential customers.
To calculate CPM, divide your total spend per ad campaign by the total impressions generated. A lower CPM indicates you’re paying less for each ad exposure, while a higher CPM suggests you’re reaching a more valuable audience.
But that doesn’t always mean you should aim for a lower CPM, particularly if delivering ads to a more expensive audience can result in more conversions and higher average order value.
Cost per acquisition (CPA), also known as cost per action or cost per conversion, measures how much you pay to acquire a new customer or conversion. It’s a key indicator of the cost-effectiveness of your advertising efforts in driving specific, valuable actions like purchases or sign-ups.
To calculate CPA, divide the total cost of your ad campaign by the number of acquisitions it generates.
This reflects the cost of driving meaningful results from your advertising. A lower CPA means you’re paying less for each new conversion, which can help you achieve a higher return on investment. However, it’s important to look at CPA within the context of other metrics like AOV and CLV to make sure you’re acquiring customers who are actually profitable for your business.
Depending on what kind of traffic dashboard you use, you may have access to reports that break down your website traffic in a number of different ways that can shed some light on your customer base.
This might include:
Knowing this info can help you tailor your campaigns. For example, if email traffic has declined over recent months, you may want to reexamine your strategy there.
If you have a large percentage of visitors coming to you on mobile devices, make sure the experience there is a positive one. And if you know where your customers are located, you can encourage conversions with regional-specific offerings.
These data points help determine how various marketing channels are performing for your business. You can choose from many different metrics listed above, like conversion rate, CAC, and CLV, but calculate them for a specific channel, like social media, email, or direct for a more targeted view of the effectiveness of your marketing campaigns.
Conversion and revenue are always going to factor into ecommerce business metrics. Otherwise, you wouldn’t know how many customers you’re attracting and how much money you’re making.
Marketing efficiency ratio, or MER, is calculated by dividing your total revenue by your total spend, which gives you a big-picture view of your marketing performance across your entire business. Yes, that’s similar to your ROAS, but slightly different in that it’s typically channel-specific and attribution-dependent.
In other words, MER tells you how many dollars in revenue you generate for every $1 spent on paid media, no matter where the conversions came from. You want this number to be high, and you’ll find it in your Triple Whale dashboard labeled as “blended ROAS.” This ecommerce metric is also sometimes called ecosystem ROAS or media efficiency ratio.
Your breakeven ROAS is a calculation of when you break even on acquiring a customer. You’re not making money on an ad campaign, but you’re not losing money, either.
There are a couple of different ways to think about and calculate your BEROAS, but one formula is:
Total revenue per product / (total revenue per product - total cost per product) = BEROAS
This is an important metric for high-growth businesses: You might take a loss up front in order to acquire new customers. Ideally, if you break even on their first purchase and they go on to become return customers, their future purchases will generate a positive contribution margin.
You can also use Triple Whale’s breakeven ROAS calculator to make the math as simple as possible.
Revenue per visitor is a combination of conversion rate and average order value that tells you how much money you make per visitor to your site. It gives you a clear picture of the health of your ecommerce shop because it also takes into account visitors who don’t make a purchase.
To calculate it, divide your total revenue during a specific period of time by your total visitors during that same time period. Then, you can try to increase this number by optimizing your site for conversions.
Tracking your business's sales by source can help you understand where your customers are coming from and what marketing channels are most effective at driving conversions. It can also help you allocate your resources more effectively.
You might already know exactly which source your sales are coming from if you run ad campaigns and are tracking the ROAS of each one. But what about campaigns you aren’t running?
Let’s say an influencer gets a hold of your product and promotes it to their followers. You suddenly get an influx of new purchases, but you’re not sure where they came from.
This is where tracking sales by source comes in handy: You can figure out which website is referring traffic to your store, even if that traffic is coming from a channel you don’t have direct control over.
If you notice a new source is performing particularly well, you could consider amping up your efforts there by running ads, working with influencers, or establishing a brand presence.
Gross margin is the difference between your cost of goods sold and the selling price of those goods. By tracking gross margin, you can ensure you’re making enough money on each sale to cover your costs and generate a profit.
Gross margin can also be a useful tool for evaluating pricing strategy. If your gross margin is low, it might be time to raise your prices to increase your profitability. On the other hand, if your gross margin is high, you might be able to lower your prices and still make a profit or use that extra profit to invest in new products, more marketing, or staff.
Once you’ve attracted a customer, you’ll want to understand how they continue to interact with your brand. Ecommerce benchmarks around customer engagement focus on maintaining loyalty among your existing customers, which is almost always cheaper than attracting new ones.
One of the go-to metrics for ecommerce in the retention category is customer retention rate. This measures the percentage of your customers you retain over a specific period of time.
Here’s how you calculate it:
(Total number of customers at the end of a period of time - number of new customers during that period) ÷ number of customers at the start of the period) x 100
You want your retention rate to be as high as possible, although achieving 100% is nearly impossible. A high retention rate is a good sign customers are pleased with their experiences with your brand and will continue to contribute to your success.
Another way to think about customer retention is to track your returning customer rate. Returning customers, sometimes also called repeat customers, are those who make at least two purchases from your ecommerce store.
Knowing this number helps you gauge the health of your business. Customers who come back are likely happy with their purchase. If they don’t come back, you probably need to make some changes.
To calculate returning customer rate, divide your number of repeat customers by your total number of customers, and multiply that number by 100. If this percentage is high, people are purchasing from your store and are happy with what they bought. They may also tell their friends or family about you, which can lead to even more business.
If it’s low, something’s off. Maybe you could offer a wider selection of products or improve the quality of your offerings.
Churn refers to customers who leave your business. This percentage is like the inverse of your retention rate. Your goal is to minimize churn as much as possible.
To calculate churn rate, use this formula:
Number of lost customers at the end of a period of time ÷ number of total customers at the end of the period x 100
If you have more churn than you’d like, you can do some customer retention analysis to assess where you might have obstacles in your sales funnel and test theories that might alleviate that friction and drive more conversions.
Your net promoter score is tabulated from post-purchase surveys you send to your customers. The surveys ask shoppers how likely they are to recommend your brand to someone, usually on a scale of “unlikely” to “highly likely.”
Those votes of confidence can result in positive word of mouth and repeat purchases—both good for your bottom line!
Abandoned shopping carts mean visitors came close to making a purchase but ultimately left your site without converting.
To calculate this figure, divide your number of purchases by your number of shopping carts created and multiply this number by 100.
A high percentage here signifies your customers aren’t ready to buy, or they’re comparison shopping and will come back later to make their purchase.
Tracking your abandoned cart rate is essential for understanding the health of your business and for making necessary changes to improve your conversion rate. By reducing your abandoned cart rate, you can increase your sales and improve your bottom line.
That said, adding a product to a shopping cart is still a sign of engagement. Measuring the percentage of visitors who take this step helps you understand the products potential customers are interested in, even if they don’t end up buying them. Tracking this metric can also help you understand which products are routinely passed over.
To figure out your add-to-cart rate, divide your total number of visitors by the total number of visitors who added something to their cart. If this number is lower than you’d like, you may need to adjust your pricing, CTAs, product imagery, site speed, and/or shipping options.
Keeping tabs on how your inventory is moving through your ecommerce store can also give you valuable insights about your business’s success.
On various ecommerce dashboards you’ll be able to see which of your products are most popular, measured by how many of them you sell. This helps you keep those hot products stocked in the moment, and it may help you iterate and come up with new product ideas in the future.
This is another ecommerce metric that helps you keep tabs on your inventory, but this one breaks things down to the daily level: Your average inventory sold per day is simply how many units of each product you offer that you sell in a given day. It’s available for Shopify stores and on other ecommerce dashboards.
Your remaining inventory at the end of a month gives you a broader sense of sales: Tallying up the amounts of your different products still in stock shows you what’s moving quickly, what’s not, and the total value of your current inventory.
Some returns and exchanges are inevitable. No matter how carefully you select your products or how well you craft your listings, there will always be customers who are not satisfied with their purchase.
While some returns and refunds are simply the result of buyer’s remorse, others may be due to damaged goods, incorrect descriptions, or other conditions. Regardless of the reason, it’s important to track product returns so you can identify any patterns and make necessary changes to your offerings.
By tracking returns and refunds, you can pinpoint which products are being returned or exchanged most often and make adjustments to your listings and/or inventory accordingly.
In case you hadn’t noticed, that was a pretty long list of ecommerce funnel metrics. And we certainly don’t expect you to use every single one. So where do you start?
You can’t go wrong by beginning with the six essential metrics listed above. But when you’re ready for a little additional detail, ask yourself a few questions to narrow down which other metrics might be the most helpful for your business.
Answering these questions thoughtfully will help you realize certain ecommerce metrics and KPIs aren’t vital to your company’s success. If you keep track of too many numbers, you might find yourself overwhelmed and unfocused. There is no one best number of KPIs every company should track, because every business is unique. But, generally speaking, focusing on two to four can give you a solid sense of how you’re doing.
Monitor metrics relevant to your company, not trends in the industry. And don’t forget, Triple Whale can help you track all the most important metrics for your business.
To effectively use ecommerce metrics to improve performance, you also need to make sure you’re designing appropriate KPIs to begin with. Choose your KPIs based on your growth stage. Startup KPIs are often different from enterprise KPIs. Some are more crucial than others. Make sure your KPIs reflect your reality.
Your strategy should be your starting point, and it should help determine your next steps. For instance, one of your critical strategic objectives could be to increase the flow of the marketing pipeline in the next financial year.
To do so, you might aim to increase your contacts through the pipeline that get handed over to sales. Your number of new subscribers is a simple way to measure the number of contacts getting into the marketing platform, so that would be an ecommerce metric you decide to track closely.
Then, you’d decide what your KPI around new subscribers would look like. One of the best ways of writing your KPIs is by using the SMART approach, which stands for specific, measurable, attainable, relevant, and time-bound.
To create a SMART KPI, ask yourself:
Avoid jargon to create an effective KPI. Everyone within your organization should understand it. To do this, you can use this structure:
Here’s an example of how that looks:
Add new sales profiles to 80,000 people by December 31, 2026.
Beginning with a verb helps clarify your goals. Metrics and units ensure your KPIs are measurable. Finishing with a deadline will make sure your KPI is timely.
The legwork is behind you: You’ve decided which metrics to track and which KPIs you’re going to work toward. Now, it’s time to put the metrics to work for you.
Regularly monitoring your chosen ecommerce metrics allows you to spot patterns and diagnose problems through data. For example, maybe traffic has suddenly plummeted, churn rate is way up, or your net promoter score took a hit. Dig into the data and come up with hypotheses as to why, and try to implement changes that might help right the ship and boost your success.
This same process can be useful for iterating on campaigns and future products. The more closely you analyze your ecommerce metrics, the more you’ll learn about your customers, their desires, and their behaviors—which makes you better suited to deliver on their needs.
It’s easy to get caught up in the process, but try your best to avoid these common hiccups when it comes to tracking ecommerce metrics.
Don’t pull data for data’s sake. Focus on metrics that actually matter when it comes to your bottom line. For example, social media followers is a commonly cited vanity metric. You might have a large TikTok following, but if those users don’t convert to customers, they don’t do much for your bottom line.
Periodically reassess the metrics you’ve chosen to monitor and make sure they’re the ones that have the biggest effect on your profitability.
A big spike in, say, order value, is exciting at first glance. But moving too quickly based on short-term data can be misguided if you’re not also taking into account sustainability for long-term growth.
Reacting to daily (or even weekly, in some cases) changes in various ecommerce metrics can feel productive, but it’s often not strategic. If you feel the pull of short-term indicators, check in with your process: Are you reacting out of impulse or making a business-minded decision? Do you also have long-term indicators in the mix? A balance of short- and long-term measurements will help you get the most well-rounded picture of your performance.
All of the metrics for ecommerce above can be calculated at the business level. But if you break them down into segments like traffic source, product category, and customer type, for example, you’ll learn even more about your bottom line.
For example, your overall conversion rate might be strong, but poor among mobile users. With this insight, you can do some checkout optimization for mobile users rather than focusing your efforts on improving overall conversions and miss the real problem.
Customer segmentation also gives you the opportunity to personalize your marketing messaging, which can help drive more conversions and higher AOV.
It’s vital for online businesses to be aware of the most important ecommerce metrics and track them regularly. By doing so, you can identify problems and opportunities early on and make necessary changes to improve your performance. These key ecommerce metrics are a great place to start, and you can add on other helpful metrics that best fit your unique situation.
Triple Whale can help you visualize and measure all of your most important ecommerce metrics and KPIs. Book a demo today!
The six key metrics listed above—conversion rate, AOV, CLV, CAC, ROAS, and click-through rate—are all great for new brands to monitor. You might also want to add in website traffic and cart abandonment rate as you’re just getting your business off the ground.
A more robust monthly check-in will, generally speaking, give you a good sense of your long-term success while not being too infrequent that you miss smaller, yet important, changes. You’ll likely also want to track certain numbers at least weekly to monitor gradual growth and spot any potentially worrisome dips.
That said, there are certain metrics that warrant more frequent tracking and certain moments when you’d want to measure more frequently. For example, it’s a good idea to keep an eye on website traffic daily. This will alert you in real time if, say, something on your site is broken. You’ll want to measure various conversion-related metrics daily while you’re running special campaigns or promotions (like a Cyber Monday sale) to keep an eye on conversion.
Ultimately, how often you track various ecommerce metrics will depend on the metric, your brand, and your goals.
Ecommerce metrics that are related to retention include:
These metrics alone don’t necessarily help improve retention unless you make a dedicated effort to improve the metrics themselves. A focused customer retention strategy can help increase these and other measures of customer retention.
It’s essential to track ecommerce metrics in order to make informed decisions about your online business. Your success depends on knowing what to measure, when to measure it, and monitoring how your numbers fluctuate over time.
This comprehensive guide will introduce you to all the ecommerce performance metrics to consider, help you understand how to measure ecommerce success, and highlight ways to improve your performance.
There are a lot of different ecommerce metrics to track, and it can be tricky to know which ones are most important for your brand. Each metric is unique in that it provides a specific measurement or data point that gives you some insight into the performance of your ecommerce store.
Metrics are different from KPIs. Key performance indicators are benchmarks you establish to help you measure how well you’re doing against your goals and objectives. Identifying the ecommerce KPIs to track is crucial for an online store’s success.
For example, a metric you track might be site traffic. You’ll get this number at a specific point in time and it will tell you how your traffic is performing. But your traffic-related KPI may be to increase by 70% over the next year.
A metric is a snapshot in time; a KPI is an outcome to strive for. Without KPIs, metrics simply give you information, not clues as to what kind of action to take next. KPIs are what guide you when it comes to optimizing, scaling, and improving performance.
There are various metrics you can decide to track based on your brand and goals (more on that below). But these are the most important ecommerce metrics everyone should keep an eye on.
The CVR marketing metric calculates the percentage of your site visitors who take a desired action, like making a purchase, signing up for a newsletter, or filling out a form.
A high conversion rate indicates your advertising and website are effectively turning visitors into customers or leads. A low conversion rate may indicate that your site needs improvement with conversion rate optimization.
There are a number of factors that can affect conversion rate, such as the design of your site, the clarity of your calls to action, and the prices of your products. By regularly monitoring your conversion rate, you can identify areas where your site could be improved in order to drive more conversions.
Your CVR directly affects the revenue you generate from advertising efforts. A higher CVR means more of the people interacting with your brand are taking meaningful actions that contribute to your bottom line.
The average CVR varies by industry, but a good CVR to aim for is above 2%.
Average order value is how much money, on average, a customer spends when placing an order with your business. This metric evaluates your customers’ purchasing behavior and your business’s overall health.
A higher AOV means customers are spending more money per transaction, which can help you generate more revenue and achieve a better return on your advertising investment.
Tracking AOV is important because it can help you spot opportunities for growth. For example, if your total sales are increasing but your AOV isn’t, your new customers aren’t adding upsells to their cart. You might need to focus on improving your cross-selling or upselling offerings.
On the other hand, if your AOV is increasing but your total sales are flat, you may be losing market share even though new customers are spending more. That might mean it’s time to invest in customer acquisition or focus on driving repeat purchases.
Ultimately, monitoring AOV is essential for any ecommerce business that wants to stay competitive and grow over time.
Any business that wants to stay afloat needs to keep track of its customer lifetime value (CLV or sometimes LTV or CLTV). This metric tells you how much revenue a customer is likely to generate over the course of their relationship with your company.
For ecommerce businesses, tracking CLV is especially important. That's because the cost of acquiring new customers is often higher than the cost of retaining existing ones. By understanding your CLV, you can make informed decisions about where to allocate your marketing budget and which customers are worth investing in.
Tracking CLV can also help you identify trends and patterns that can be used to improve your customer experience.
It’s important to know where your customers are coming from and how much it costs to acquire them. This is known as your customer acquisition cost (CAC).
By tracking CAC, you can make informed decisions about where to allocate your resources in order to attract new customers. For example, if you’re spending more on advertising than you’re making in sales, it might be time to reevaluate your strategy.
On the other hand, if a particular marketing campaign is resulting in a high number of new customers at a low cost, it may be worth investing more in that area. Tracking CAC can also help you identify areas where you may be overspending or underperforming.
With return on ad spend (ROAS), you can gauge how efficient an ad campaign is, which will allow you to make adjustments to the campaign accordingly. You can monitor the return on your ad spend to ensure your efforts drive revenue growth.
ROAS tells you how much money you’re making for every dollar invested in advertising. It helps you understand the profitability of your marketing efforts and make informed decisions about budget allocation and optimization.
A higher ROAS indicates your advertising is more effective at driving revenue, while a lower ROAS suggests you may need to optimize your campaigns to improve profitability.
Track your ROAS for every campaign you run; this allows you to determine which campaigns are successful and which aren’t worth the money.
That’s what makes ROAS such an important metric to track: It tells you whether your advertising budget is being used effectively. This, in turn, can help you to maximize your profits and grow your business.
Click-through rate (CTR) measures the percentage of people who click on your ad after seeing it. It indicates how engaging and relevant your ad is to your target audience.
A high CTR suggests your ad is effectively capturing attention and encouraging people to take action, while a low CTR may indicate your ad isn’t resonating with your audience. What’s considered a “good” CTR varies by industry and platform, but the average for display ads is less than 1%, according to marketing education platform CXL.
Those were the top ecommerce metrics—but there are lots of other basic ecommerce metrics you might want to consider calculating and tracking, too.
We’ve broken them down by different KPIs for ecommerce so you can pick and choose from different categories of information.
Acquisition and traffic numbers are important ecommerce metrics because they tell you more about how many visitors are coming to your website (or app). If you’re going to convert visitors into customers, you have to get their attention first!
Although website traffic doesn’t directly correlate with revenue or profit, it’s an important metric to check to ensure your business is on the right trajectory. You can track traffic through most website analytics platforms.
Getting quality traffic with high buyer-intent should always be the goal of every ecommerce store. Don’t sacrifice a small amount of high-quality traffic for a large amount of lower-quality traffic that doesn’t convert. The overall number doesn’t need to be huge, but you should strive to continuously grow your high-quality website traffic.
Regularly monitoring traffic will also allow you to spot and address any potential issues with your site that contribute to a negative customer experience, such as broken links or pages that take too long to load. In today's competitive online landscape, optimizing your customer experience is more important than ever.
Impressions are simply the total number of times your ad appears in front of a user. It doesn’t have anything to do with interactions or clicks, but users can’t interact with your business if they don’t see it.
Impressions is a baseline metric that signifies your potential for reach and visibility and contributes to exposure and brand awareness. You can track it using many different analytics tools.
Reach is a similar metric of ad exposure but slightly different from impressions. Your reach measures how many different users have seen your ad. (Impressions can measure multiple views by the same user.)
A high reach means your ads are being seen by a wider audience, which is a good thing when it comes to acquiring new customers.
Not to be confused with customer engagement, engagement aims to measure how users are interacting with your content, by tallying up interactions such as likes, comments, shares, and time spent on page.
Generally speaking, higher engagement is a sign of brand loyalty and connection, which can drive conversions and profitability over time.
Bounce rate is another important website traffic metric that tells you how many website visitors leave your site after only viewing one page. That means you want your bounce rate to be low.
Cost per click measures how much it costs to generate a single click from an online ad. Tracking CPC is essential for understanding the return on your marketing efforts.
By understanding your CPC, you can adjust your ad spend accordingly and focus on those platforms and audiences that are more likely to generate conversions. It’s a popular pricing model for search engine and social media advertising.
To calculate CPC, divide the total cost of an ad campaign by the number of clicks it received. A lower CPC means you’re paying less for each click, which can help you stretch your advertising budget further. A sudden increase in CPC could be a sign your ad is saturated or you’re marketing to the wrong audience.
That said, you want the clicks you’re paying for to translate into meaningful actions like purchases. To that end, you might accept a higher CPC if serving your ads to an audience that’s more expensive to reach translates into more conversions.
Cost per thousand impressions or CPM is a measure of the cost of 1,000 ad impressions. An ad impression is counted each time your ad is displayed, regardless of whether a user clicks it or not.
CPM is commonly used in online display advertising, where you pay based on the number of times your ad is shown to potential customers.
To calculate CPM, divide your total spend per ad campaign by the total impressions generated. A lower CPM indicates you’re paying less for each ad exposure, while a higher CPM suggests you’re reaching a more valuable audience.
But that doesn’t always mean you should aim for a lower CPM, particularly if delivering ads to a more expensive audience can result in more conversions and higher average order value.
Cost per acquisition (CPA), also known as cost per action or cost per conversion, measures how much you pay to acquire a new customer or conversion. It’s a key indicator of the cost-effectiveness of your advertising efforts in driving specific, valuable actions like purchases or sign-ups.
To calculate CPA, divide the total cost of your ad campaign by the number of acquisitions it generates.
This reflects the cost of driving meaningful results from your advertising. A lower CPA means you’re paying less for each new conversion, which can help you achieve a higher return on investment. However, it’s important to look at CPA within the context of other metrics like AOV and CLV to make sure you’re acquiring customers who are actually profitable for your business.
Depending on what kind of traffic dashboard you use, you may have access to reports that break down your website traffic in a number of different ways that can shed some light on your customer base.
This might include:
Knowing this info can help you tailor your campaigns. For example, if email traffic has declined over recent months, you may want to reexamine your strategy there.
If you have a large percentage of visitors coming to you on mobile devices, make sure the experience there is a positive one. And if you know where your customers are located, you can encourage conversions with regional-specific offerings.
These data points help determine how various marketing channels are performing for your business. You can choose from many different metrics listed above, like conversion rate, CAC, and CLV, but calculate them for a specific channel, like social media, email, or direct for a more targeted view of the effectiveness of your marketing campaigns.
Conversion and revenue are always going to factor into ecommerce business metrics. Otherwise, you wouldn’t know how many customers you’re attracting and how much money you’re making.
Marketing efficiency ratio, or MER, is calculated by dividing your total revenue by your total spend, which gives you a big-picture view of your marketing performance across your entire business. Yes, that’s similar to your ROAS, but slightly different in that it’s typically channel-specific and attribution-dependent.
In other words, MER tells you how many dollars in revenue you generate for every $1 spent on paid media, no matter where the conversions came from. You want this number to be high, and you’ll find it in your Triple Whale dashboard labeled as “blended ROAS.” This ecommerce metric is also sometimes called ecosystem ROAS or media efficiency ratio.
Your breakeven ROAS is a calculation of when you break even on acquiring a customer. You’re not making money on an ad campaign, but you’re not losing money, either.
There are a couple of different ways to think about and calculate your BEROAS, but one formula is:
Total revenue per product / (total revenue per product - total cost per product) = BEROAS
This is an important metric for high-growth businesses: You might take a loss up front in order to acquire new customers. Ideally, if you break even on their first purchase and they go on to become return customers, their future purchases will generate a positive contribution margin.
You can also use Triple Whale’s breakeven ROAS calculator to make the math as simple as possible.
Revenue per visitor is a combination of conversion rate and average order value that tells you how much money you make per visitor to your site. It gives you a clear picture of the health of your ecommerce shop because it also takes into account visitors who don’t make a purchase.
To calculate it, divide your total revenue during a specific period of time by your total visitors during that same time period. Then, you can try to increase this number by optimizing your site for conversions.
Tracking your business's sales by source can help you understand where your customers are coming from and what marketing channels are most effective at driving conversions. It can also help you allocate your resources more effectively.
You might already know exactly which source your sales are coming from if you run ad campaigns and are tracking the ROAS of each one. But what about campaigns you aren’t running?
Let’s say an influencer gets a hold of your product and promotes it to their followers. You suddenly get an influx of new purchases, but you’re not sure where they came from.
This is where tracking sales by source comes in handy: You can figure out which website is referring traffic to your store, even if that traffic is coming from a channel you don’t have direct control over.
If you notice a new source is performing particularly well, you could consider amping up your efforts there by running ads, working with influencers, or establishing a brand presence.
Gross margin is the difference between your cost of goods sold and the selling price of those goods. By tracking gross margin, you can ensure you’re making enough money on each sale to cover your costs and generate a profit.
Gross margin can also be a useful tool for evaluating pricing strategy. If your gross margin is low, it might be time to raise your prices to increase your profitability. On the other hand, if your gross margin is high, you might be able to lower your prices and still make a profit or use that extra profit to invest in new products, more marketing, or staff.
Once you’ve attracted a customer, you’ll want to understand how they continue to interact with your brand. Ecommerce benchmarks around customer engagement focus on maintaining loyalty among your existing customers, which is almost always cheaper than attracting new ones.
One of the go-to metrics for ecommerce in the retention category is customer retention rate. This measures the percentage of your customers you retain over a specific period of time.
Here’s how you calculate it:
(Total number of customers at the end of a period of time - number of new customers during that period) ÷ number of customers at the start of the period) x 100
You want your retention rate to be as high as possible, although achieving 100% is nearly impossible. A high retention rate is a good sign customers are pleased with their experiences with your brand and will continue to contribute to your success.
Another way to think about customer retention is to track your returning customer rate. Returning customers, sometimes also called repeat customers, are those who make at least two purchases from your ecommerce store.
Knowing this number helps you gauge the health of your business. Customers who come back are likely happy with their purchase. If they don’t come back, you probably need to make some changes.
To calculate returning customer rate, divide your number of repeat customers by your total number of customers, and multiply that number by 100. If this percentage is high, people are purchasing from your store and are happy with what they bought. They may also tell their friends or family about you, which can lead to even more business.
If it’s low, something’s off. Maybe you could offer a wider selection of products or improve the quality of your offerings.
Churn refers to customers who leave your business. This percentage is like the inverse of your retention rate. Your goal is to minimize churn as much as possible.
To calculate churn rate, use this formula:
Number of lost customers at the end of a period of time ÷ number of total customers at the end of the period x 100
If you have more churn than you’d like, you can do some customer retention analysis to assess where you might have obstacles in your sales funnel and test theories that might alleviate that friction and drive more conversions.
Your net promoter score is tabulated from post-purchase surveys you send to your customers. The surveys ask shoppers how likely they are to recommend your brand to someone, usually on a scale of “unlikely” to “highly likely.”
Those votes of confidence can result in positive word of mouth and repeat purchases—both good for your bottom line!
Abandoned shopping carts mean visitors came close to making a purchase but ultimately left your site without converting.
To calculate this figure, divide your number of purchases by your number of shopping carts created and multiply this number by 100.
A high percentage here signifies your customers aren’t ready to buy, or they’re comparison shopping and will come back later to make their purchase.
Tracking your abandoned cart rate is essential for understanding the health of your business and for making necessary changes to improve your conversion rate. By reducing your abandoned cart rate, you can increase your sales and improve your bottom line.
That said, adding a product to a shopping cart is still a sign of engagement. Measuring the percentage of visitors who take this step helps you understand the products potential customers are interested in, even if they don’t end up buying them. Tracking this metric can also help you understand which products are routinely passed over.
To figure out your add-to-cart rate, divide your total number of visitors by the total number of visitors who added something to their cart. If this number is lower than you’d like, you may need to adjust your pricing, CTAs, product imagery, site speed, and/or shipping options.
Keeping tabs on how your inventory is moving through your ecommerce store can also give you valuable insights about your business’s success.
On various ecommerce dashboards you’ll be able to see which of your products are most popular, measured by how many of them you sell. This helps you keep those hot products stocked in the moment, and it may help you iterate and come up with new product ideas in the future.
This is another ecommerce metric that helps you keep tabs on your inventory, but this one breaks things down to the daily level: Your average inventory sold per day is simply how many units of each product you offer that you sell in a given day. It’s available for Shopify stores and on other ecommerce dashboards.
Your remaining inventory at the end of a month gives you a broader sense of sales: Tallying up the amounts of your different products still in stock shows you what’s moving quickly, what’s not, and the total value of your current inventory.
Some returns and exchanges are inevitable. No matter how carefully you select your products or how well you craft your listings, there will always be customers who are not satisfied with their purchase.
While some returns and refunds are simply the result of buyer’s remorse, others may be due to damaged goods, incorrect descriptions, or other conditions. Regardless of the reason, it’s important to track product returns so you can identify any patterns and make necessary changes to your offerings.
By tracking returns and refunds, you can pinpoint which products are being returned or exchanged most often and make adjustments to your listings and/or inventory accordingly.
In case you hadn’t noticed, that was a pretty long list of ecommerce funnel metrics. And we certainly don’t expect you to use every single one. So where do you start?
You can’t go wrong by beginning with the six essential metrics listed above. But when you’re ready for a little additional detail, ask yourself a few questions to narrow down which other metrics might be the most helpful for your business.
Answering these questions thoughtfully will help you realize certain ecommerce metrics and KPIs aren’t vital to your company’s success. If you keep track of too many numbers, you might find yourself overwhelmed and unfocused. There is no one best number of KPIs every company should track, because every business is unique. But, generally speaking, focusing on two to four can give you a solid sense of how you’re doing.
Monitor metrics relevant to your company, not trends in the industry. And don’t forget, Triple Whale can help you track all the most important metrics for your business.
To effectively use ecommerce metrics to improve performance, you also need to make sure you’re designing appropriate KPIs to begin with. Choose your KPIs based on your growth stage. Startup KPIs are often different from enterprise KPIs. Some are more crucial than others. Make sure your KPIs reflect your reality.
Your strategy should be your starting point, and it should help determine your next steps. For instance, one of your critical strategic objectives could be to increase the flow of the marketing pipeline in the next financial year.
To do so, you might aim to increase your contacts through the pipeline that get handed over to sales. Your number of new subscribers is a simple way to measure the number of contacts getting into the marketing platform, so that would be an ecommerce metric you decide to track closely.
Then, you’d decide what your KPI around new subscribers would look like. One of the best ways of writing your KPIs is by using the SMART approach, which stands for specific, measurable, attainable, relevant, and time-bound.
To create a SMART KPI, ask yourself:
Avoid jargon to create an effective KPI. Everyone within your organization should understand it. To do this, you can use this structure:
Here’s an example of how that looks:
Add new sales profiles to 80,000 people by December 31, 2026.
Beginning with a verb helps clarify your goals. Metrics and units ensure your KPIs are measurable. Finishing with a deadline will make sure your KPI is timely.
The legwork is behind you: You’ve decided which metrics to track and which KPIs you’re going to work toward. Now, it’s time to put the metrics to work for you.
Regularly monitoring your chosen ecommerce metrics allows you to spot patterns and diagnose problems through data. For example, maybe traffic has suddenly plummeted, churn rate is way up, or your net promoter score took a hit. Dig into the data and come up with hypotheses as to why, and try to implement changes that might help right the ship and boost your success.
This same process can be useful for iterating on campaigns and future products. The more closely you analyze your ecommerce metrics, the more you’ll learn about your customers, their desires, and their behaviors—which makes you better suited to deliver on their needs.
It’s easy to get caught up in the process, but try your best to avoid these common hiccups when it comes to tracking ecommerce metrics.
Don’t pull data for data’s sake. Focus on metrics that actually matter when it comes to your bottom line. For example, social media followers is a commonly cited vanity metric. You might have a large TikTok following, but if those users don’t convert to customers, they don’t do much for your bottom line.
Periodically reassess the metrics you’ve chosen to monitor and make sure they’re the ones that have the biggest effect on your profitability.
A big spike in, say, order value, is exciting at first glance. But moving too quickly based on short-term data can be misguided if you’re not also taking into account sustainability for long-term growth.
Reacting to daily (or even weekly, in some cases) changes in various ecommerce metrics can feel productive, but it’s often not strategic. If you feel the pull of short-term indicators, check in with your process: Are you reacting out of impulse or making a business-minded decision? Do you also have long-term indicators in the mix? A balance of short- and long-term measurements will help you get the most well-rounded picture of your performance.
All of the metrics for ecommerce above can be calculated at the business level. But if you break them down into segments like traffic source, product category, and customer type, for example, you’ll learn even more about your bottom line.
For example, your overall conversion rate might be strong, but poor among mobile users. With this insight, you can do some checkout optimization for mobile users rather than focusing your efforts on improving overall conversions and miss the real problem.
Customer segmentation also gives you the opportunity to personalize your marketing messaging, which can help drive more conversions and higher AOV.
It’s vital for online businesses to be aware of the most important ecommerce metrics and track them regularly. By doing so, you can identify problems and opportunities early on and make necessary changes to improve your performance. These key ecommerce metrics are a great place to start, and you can add on other helpful metrics that best fit your unique situation.
Triple Whale can help you visualize and measure all of your most important ecommerce metrics and KPIs. Book a demo today!
The six key metrics listed above—conversion rate, AOV, CLV, CAC, ROAS, and click-through rate—are all great for new brands to monitor. You might also want to add in website traffic and cart abandonment rate as you’re just getting your business off the ground.
A more robust monthly check-in will, generally speaking, give you a good sense of your long-term success while not being too infrequent that you miss smaller, yet important, changes. You’ll likely also want to track certain numbers at least weekly to monitor gradual growth and spot any potentially worrisome dips.
That said, there are certain metrics that warrant more frequent tracking and certain moments when you’d want to measure more frequently. For example, it’s a good idea to keep an eye on website traffic daily. This will alert you in real time if, say, something on your site is broken. You’ll want to measure various conversion-related metrics daily while you’re running special campaigns or promotions (like a Cyber Monday sale) to keep an eye on conversion.
Ultimately, how often you track various ecommerce metrics will depend on the metric, your brand, and your goals.
Ecommerce metrics that are related to retention include:
These metrics alone don’t necessarily help improve retention unless you make a dedicated effort to improve the metrics themselves. A focused customer retention strategy can help increase these and other measures of customer retention.
.webp)

Body Copy: The following benchmarks compare advertising metrics from April 1-17 to the previous period. Considering President Trump first unveiled his tariffs on April 2, the timing corresponds with potential changes in advertising behavior among ecommerce brands (though it isn’t necessarily correlated).


.webp)

.webp)


.png)


.png)
