


Google is the most popular search engine worldwide, and it holds 79.1% of the global market share as of early 2025. While other search engines continue to climb in popularity, Google is still very often the search engine of choice for consumers, especially when shopping for products to purchase.
Google knows this and has adjusted its advertising platform to take advantage of it.
In Triple Whale’s BFCM 2024 Retrospective Report, we analyzed data from over 29,000 stores to determine how brands advertised (and converted) over BFCM 2024 compared to 2023.
When investigating the data, we found that Meta and Google continue to dominate advertising budgets, with about 90% of all ad spend dedicated to those two channels.
While there are similarities in where brands spend their advertising dollars, there are differences in how they spend it.
To prepare for BFCM 2025, we believe it is helpful to dig deeper into the Google Ads trends, to determine how brands choose to spend advertising dollars, both overall and across different industries.
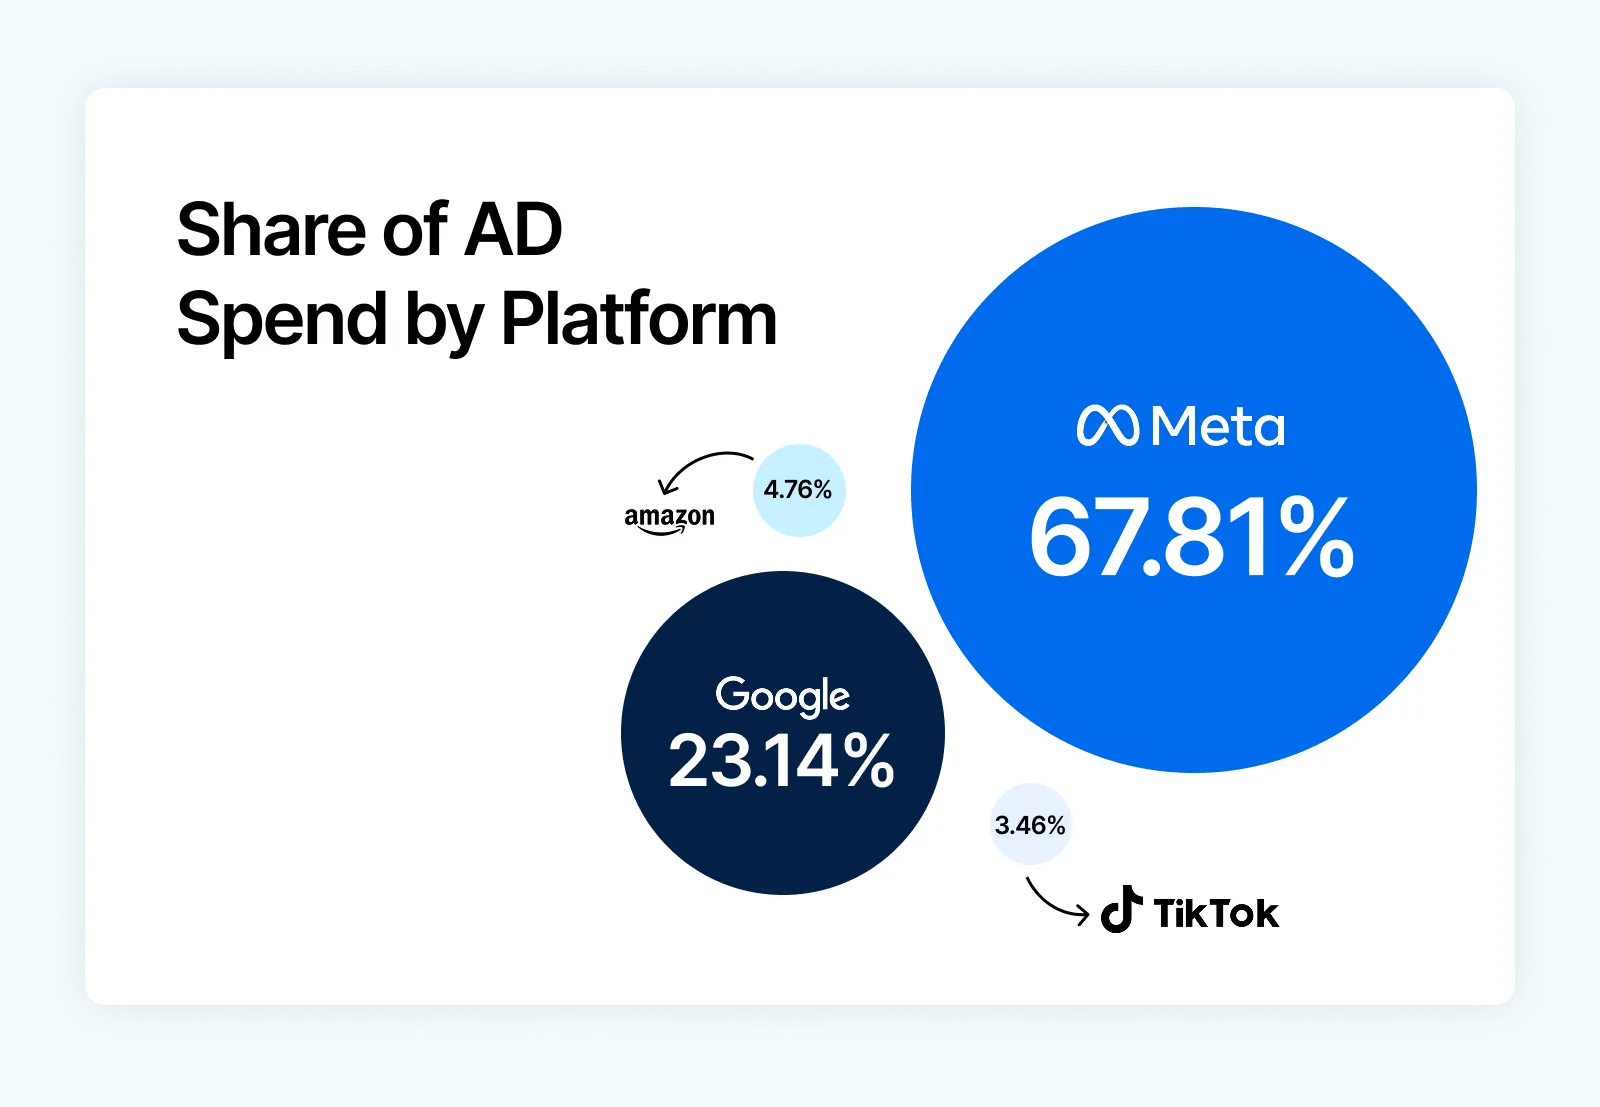
Across all shops in our report, 23.14% of total ad spend during BFCM was allocated to Google Ads, coming in second place to Meta (Facebook & Instagram) at 67.81%. There was a slight drop in ad spend for Google of -4.12%, indicating that brands are starting to further diversify their ad spend across the various platforms available.
But, why might that be?
It’s more expensive than ever to get eyeballs on your content, with Google Ads’ CPM at $17.77 across all shops. Brands might simply be choosing to invest in platforms that are more cost-effective (looking at you, TikTok…for now).
It’s also likely that Google Ads’ CPM hike is due to the adoption of Performance Max (PMax) campaigns, which could increase both the cost and competition across ecommerce businesses.
Acquiring customers was more expensive for BFCM 2024 than 2023, with the average CPA on Google Ads hitting $18.32 (a +26.43% increase from 2023). According to Wordstream, CPA has risen in 21 of 23 industries they investigated, with an overall increase of 19%.
Consumers are simply having to be more careful with how they spend their money, especially for goods they may consider non-essential. This could mean more browsing, longer times to conversion, and impacts to attribution for longer conversion windows.
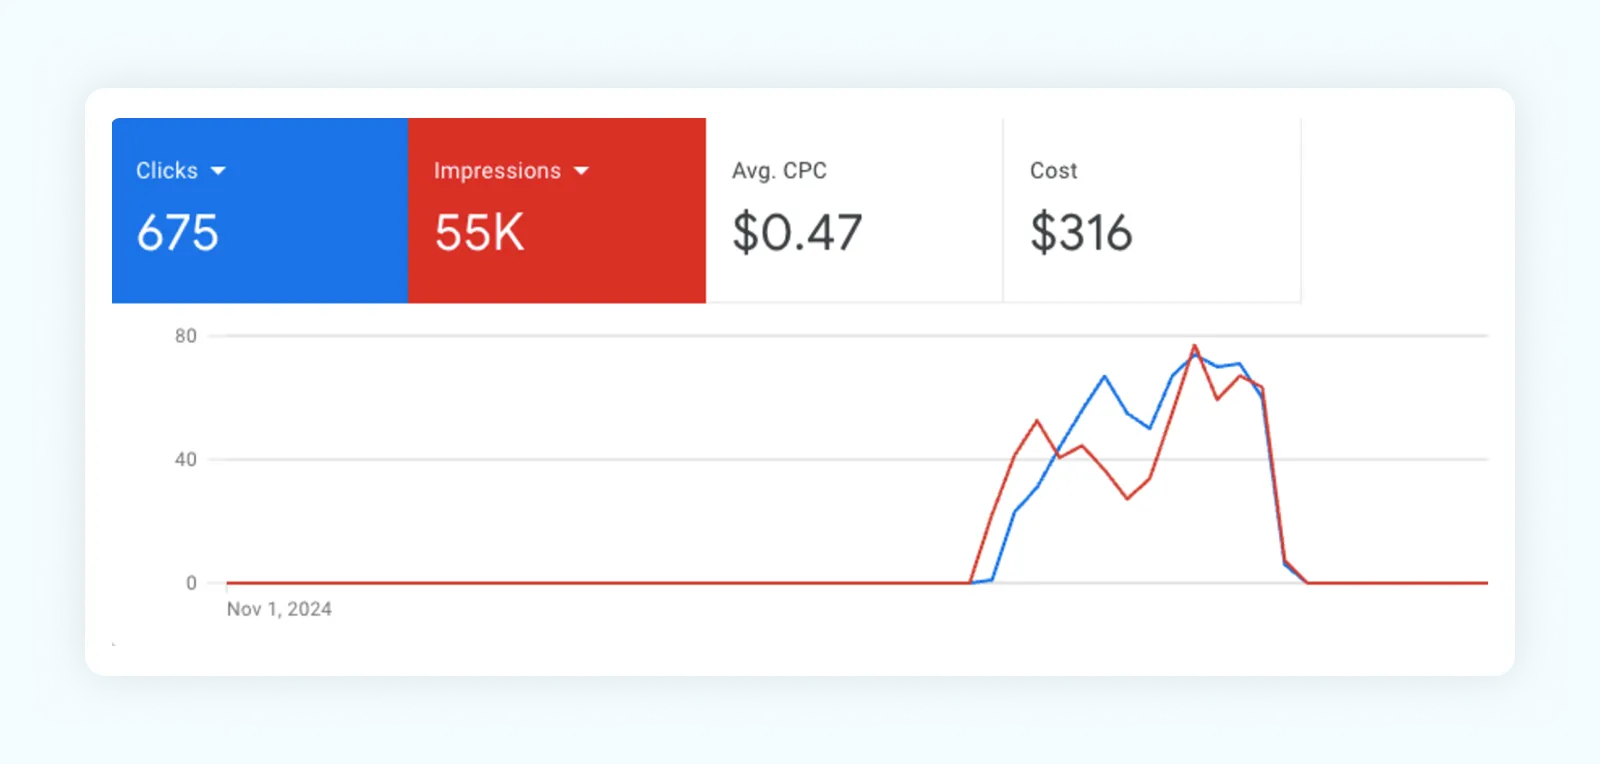
It might be a trend that Google Ads are more expensive, and obviously more competitive during BFCM. During BFCM 2024, Google Ads saw an increase of +3.10% to $1.53 for cost per click, gaining a tie with Amazon for highest CPC of all platforms.
Brands aren’t spending a ton of coin on ads that don’t work. The BFCM Retrospective Report found that Google retained the second-highest conversion rate (7.29%) even though it dropped by -18.18% compared to BFCM 2023. So although it is more costly than before, it’s still a contender for highest conversion rate amongst Meta and Amazon (3.62% and 15.27%, respectively).
Compared to BFCM 2023, the click-through rate for Google Ads dropped by -8.90% to 1.33%, but this was still the second highest click-through rate of all platforms (Meta won with 1.79%, a +13.29% increase over BFCM 2023). Since many shoppers will be exposed to a brand on a different platform then come to Google to search for the product, it’s likely to remain a platform with a high CTR for Google Ads, as customers are searching with purchase intent.
Google Ads had the second highest AOV ($88.17) of all ad platforms, and this was +1.61% higher than BFCM 2023. As mentioned previously, it’s likely that other channels with lower AOV are better for impulsive, small value orders. The slight increase in AOV on Google Ads indicates brands are more efficient at driving up cart value using Google Ads than in previous years.
While all of the above metrics indicate it is mostly more expensive to run Google Ads, it’s still clear that Google Ads are one of the top platforms for conversion rate (7.29%). Only Amazon (15.27%) was higher for BFCM 2024, and this is unsurprising considering customers are actively shopping on Amazon and very likely to click on promoted products. So, even if it is advisable to diversify ad spend across a variety of platforms, it is important to retain Google Ads as a healthy portion of your platform mix.
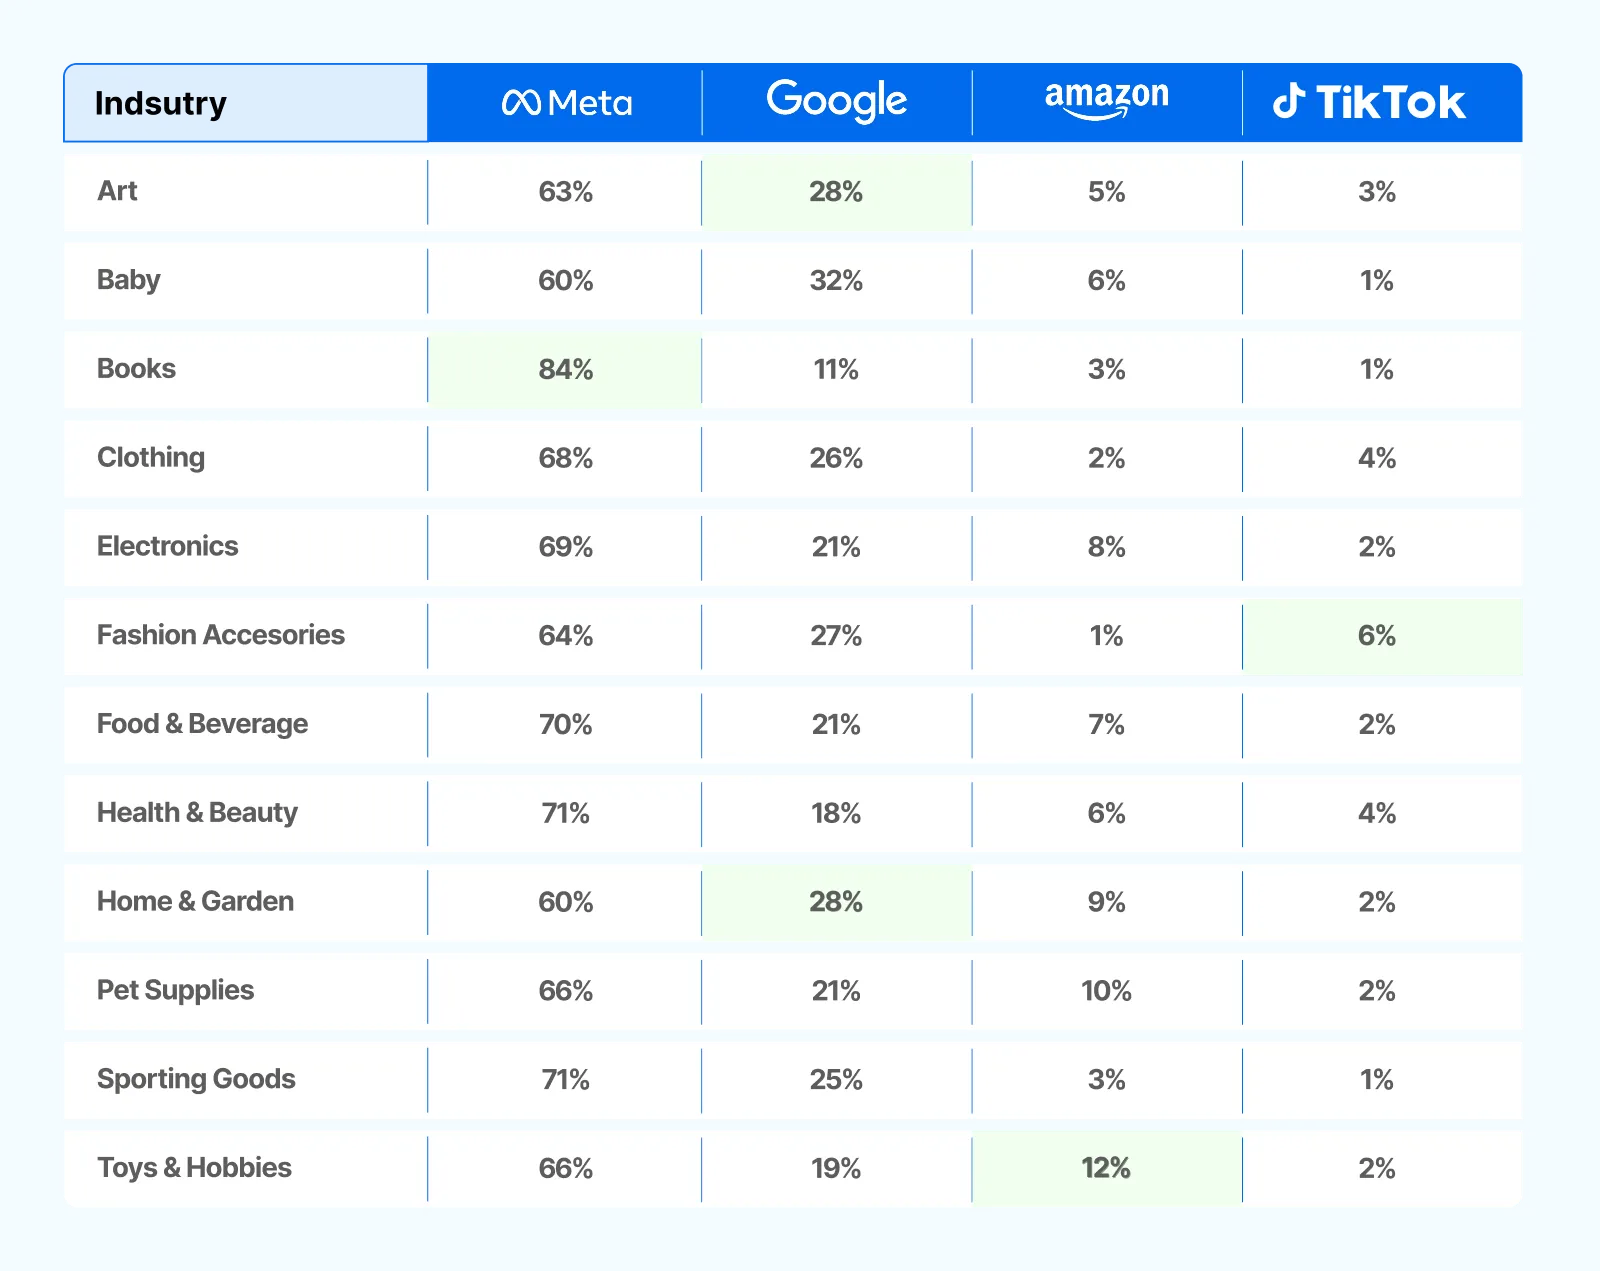
While all brands invested the most ad spend on Meta ads, brands in specific industries tended to invest a higher portion of their ad spend on Google Ads specifically:
There are a few reasons why the above industries tend to perform better with Google Ads, and thus have a higher investment on Google Ads than the other listed platforms:
1. High purchase intent. Data shows that 81% of users aged 16-64 use Google to purchase items, and anyone searching for these products on Google is likely ready to purchase at that moment.
2. Search intent vs. discovery shopping. Search ads are shown when relevant to the search query a user has entered, making it easier to capture people with purchase intent. These categories excel because:
On other platforms like Meta or TikTok, ads are often geared more towards introducing a consumer to the brand and educating them about the product benefits, whereas Google Ads perform better once the customer already knows either the brand or the product they specifically need.
Google’s efficiency decline (-12.18% ROAS, +17.82% CPA in H1 2025) means you need to take a more surgical approach to make this platform profitable during BFCM 2025. The days of broad Google campaigns are over – success requires precision targeting and strict cost controls. Here are some suggestions for some Google-focused strategies:
Google will be expensive during BFCM, so aim to budget for 25-30% higher CPCs than during normal periods.
Target only branded terms, competitor comparisons, and high-commercial intent keywords with clear purchase signals, as these tend to perform best on Google Ads.
With declining efficiency, it’s necessary to aggressively manage CPA.
Let other platforms handle what they do best: awareness and consideration.
With search efficiency declining, YouTube offers something better for top-of-funnel ads.

Use automation only where it’s been proven to be effective.

Monitor competitor activity and adjust accordingly.
The data in the BFCM Retrospective Report demonstrates a significant role for Google Ads in the advertising strategies of businesses across various revenue tiers.
The investment in this platform consistently accounts for a substantial portion of total ad spend, and it's a key contributor to revenue generation. Google Ads still accounts for 28.4% of all ad revenue in the United States, but the year-over-year trends suggest that brands, particularly those in the higher revenue brackets, are starting to diversify their advertising investments. Newer platforms like TikTok are gaining traction, reflecting a shift in marketing strategies to tap into different audience demographics.
This highlights the dynamic nature of the digital advertising landscape and underscores the need for brands to stay agile, adapting their strategies to evolving consumer behaviors and market trends.
If you’re curious how your BFCM data stacks up to our aggregate data from over 29,000 Triple Whale brands, download the report.
Google is the most popular search engine worldwide, and it holds 79.1% of the global market share as of early 2025. While other search engines continue to climb in popularity, Google is still very often the search engine of choice for consumers, especially when shopping for products to purchase.
Google knows this and has adjusted its advertising platform to take advantage of it.
In Triple Whale’s BFCM 2024 Retrospective Report, we analyzed data from over 29,000 stores to determine how brands advertised (and converted) over BFCM 2024 compared to 2023.
When investigating the data, we found that Meta and Google continue to dominate advertising budgets, with about 90% of all ad spend dedicated to those two channels.
While there are similarities in where brands spend their advertising dollars, there are differences in how they spend it.
To prepare for BFCM 2025, we believe it is helpful to dig deeper into the Google Ads trends, to determine how brands choose to spend advertising dollars, both overall and across different industries.
Across all shops in our report, 23.14% of total ad spend during BFCM was allocated to Google Ads, coming in second place to Meta (Facebook & Instagram) at 67.81%. There was a slight drop in ad spend for Google of -4.12%, indicating that brands are starting to further diversify their ad spend across the various platforms available.
But, why might that be?
It’s more expensive than ever to get eyeballs on your content, with Google Ads’ CPM at $17.77 across all shops. Brands might simply be choosing to invest in platforms that are more cost-effective (looking at you, TikTok…for now).
It’s also likely that Google Ads’ CPM hike is due to the adoption of Performance Max (PMax) campaigns, which could increase both the cost and competition across ecommerce businesses.
Acquiring customers was more expensive for BFCM 2024 than 2023, with the average CPA on Google Ads hitting $18.32 (a +26.43% increase from 2023). According to Wordstream, CPA has risen in 21 of 23 industries they investigated, with an overall increase of 19%.
Consumers are simply having to be more careful with how they spend their money, especially for goods they may consider non-essential. This could mean more browsing, longer times to conversion, and impacts to attribution for longer conversion windows.
It might be a trend that Google Ads are more expensive, and obviously more competitive during BFCM. During BFCM 2024, Google Ads saw an increase of +3.10% to $1.53 for cost per click, gaining a tie with Amazon for highest CPC of all platforms.
Brands aren’t spending a ton of coin on ads that don’t work. The BFCM Retrospective Report found that Google retained the second-highest conversion rate (7.29%) even though it dropped by -18.18% compared to BFCM 2023. So although it is more costly than before, it’s still a contender for highest conversion rate amongst Meta and Amazon (3.62% and 15.27%, respectively).
Compared to BFCM 2023, the click-through rate for Google Ads dropped by -8.90% to 1.33%, but this was still the second highest click-through rate of all platforms (Meta won with 1.79%, a +13.29% increase over BFCM 2023). Since many shoppers will be exposed to a brand on a different platform then come to Google to search for the product, it’s likely to remain a platform with a high CTR for Google Ads, as customers are searching with purchase intent.
Google Ads had the second highest AOV ($88.17) of all ad platforms, and this was +1.61% higher than BFCM 2023. As mentioned previously, it’s likely that other channels with lower AOV are better for impulsive, small value orders. The slight increase in AOV on Google Ads indicates brands are more efficient at driving up cart value using Google Ads than in previous years.
While all of the above metrics indicate it is mostly more expensive to run Google Ads, it’s still clear that Google Ads are one of the top platforms for conversion rate (7.29%). Only Amazon (15.27%) was higher for BFCM 2024, and this is unsurprising considering customers are actively shopping on Amazon and very likely to click on promoted products. So, even if it is advisable to diversify ad spend across a variety of platforms, it is important to retain Google Ads as a healthy portion of your platform mix.
While all brands invested the most ad spend on Meta ads, brands in specific industries tended to invest a higher portion of their ad spend on Google Ads specifically:
There are a few reasons why the above industries tend to perform better with Google Ads, and thus have a higher investment on Google Ads than the other listed platforms:
1. High purchase intent. Data shows that 81% of users aged 16-64 use Google to purchase items, and anyone searching for these products on Google is likely ready to purchase at that moment.
2. Search intent vs. discovery shopping. Search ads are shown when relevant to the search query a user has entered, making it easier to capture people with purchase intent. These categories excel because:
On other platforms like Meta or TikTok, ads are often geared more towards introducing a consumer to the brand and educating them about the product benefits, whereas Google Ads perform better once the customer already knows either the brand or the product they specifically need.
Google’s efficiency decline (-12.18% ROAS, +17.82% CPA in H1 2025) means you need to take a more surgical approach to make this platform profitable during BFCM 2025. The days of broad Google campaigns are over – success requires precision targeting and strict cost controls. Here are some suggestions for some Google-focused strategies:
Google will be expensive during BFCM, so aim to budget for 25-30% higher CPCs than during normal periods.
Target only branded terms, competitor comparisons, and high-commercial intent keywords with clear purchase signals, as these tend to perform best on Google Ads.
With declining efficiency, it’s necessary to aggressively manage CPA.
Let other platforms handle what they do best: awareness and consideration.
With search efficiency declining, YouTube offers something better for top-of-funnel ads.
Use automation only where it’s been proven to be effective.
Monitor competitor activity and adjust accordingly.
The data in the BFCM Retrospective Report demonstrates a significant role for Google Ads in the advertising strategies of businesses across various revenue tiers.
The investment in this platform consistently accounts for a substantial portion of total ad spend, and it's a key contributor to revenue generation. Google Ads still accounts for 28.4% of all ad revenue in the United States, but the year-over-year trends suggest that brands, particularly those in the higher revenue brackets, are starting to diversify their advertising investments. Newer platforms like TikTok are gaining traction, reflecting a shift in marketing strategies to tap into different audience demographics.
This highlights the dynamic nature of the digital advertising landscape and underscores the need for brands to stay agile, adapting their strategies to evolving consumer behaviors and market trends.
If you’re curious how your BFCM data stacks up to our aggregate data from over 29,000 Triple Whale brands, download the report.


Body Copy: The following benchmarks compare advertising metrics from April 1-17 to the previous period. Considering President Trump first unveiled his tariffs on April 2, the timing corresponds with potential changes in advertising behavior among ecommerce brands (though it isn’t necessarily correlated).


.webp)

.webp)


.png)


.jpg)

.png)
