


It’s no secret it’s less expensive to retain an existing customer than to it is acquire a new one. But you won’t know exactly how well your customer retention strategies are working without some careful customer retention analysis.
Keep reading to learn more about the retention analytics to pay attention to and how to conduct your analysis for the most helpful takeaways.
Customer retention is your business’s ability to keep your customers over time. A high retention rate drives higher customer lifetime value and long-term profitability. And customer retention analytics help you understand how effective your strategy is and where you might be able to make improvements.
Customer retention analytics or user retention analytics involves analyzing various metrics about your visitors and customers so you can better understand the driving factors behind their purchases, loyalty, and order value.
Analyzing your customer retention data can also help you understand what drives some users away without making more purchases, called customer churn. In other words, this process gives you a better sense of why some customers stick around and others bounce.
It involves monitoring a number of metrics and methods for tracking past customer behavior as well as some predictive analytics for forecasting future behavior, usually over a specific period of time and sometimes even among a certain segment of users.
Customer retention analytics is a process; there are multiple metrics worth tracking so you can get as complete a picture of your success as possible. Here are some of the key numbers to take a look at.
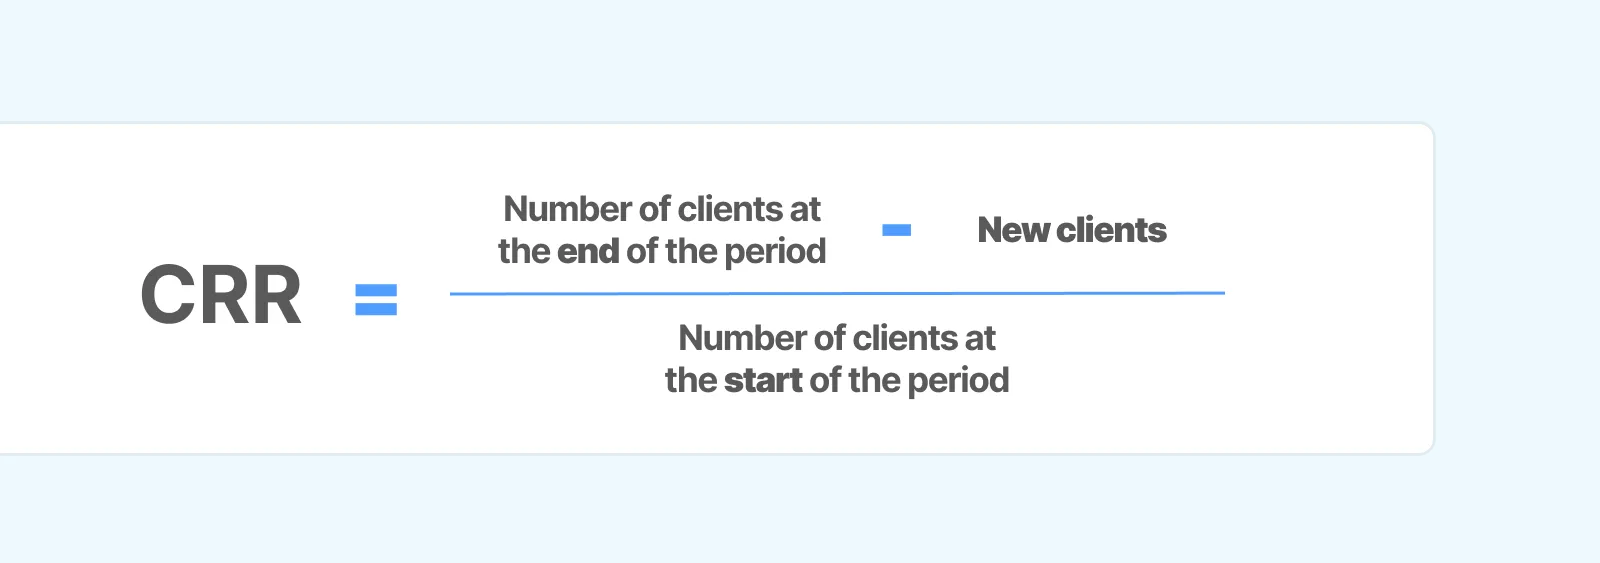
This metric gives you the percentage of your customers you retain over a specific period of time. You calculate it by subtracting your new customers during a certain time period from the total number of customers you have at the end of that period of time. Divide that number by your number of customers at the start of the period, and multiply that by 100.
You want your customer retention rate to be high; that means more of your customers are sticking with you and making repeat purchases, which is, of course, good for business.
Customer churn rate, on the other hand, is basically the opposite of your customer retention rate. This metric tells you the percentage of your customers who have left your business over a period of time. Customer churn analysis can help you figure out what’s driving users away and make adjustments to improve your score.
You can calculate yours by dividing the number of customers who left over a specific time period by your total number of customers at the start of that period, and then multiplying that number by 100. You want this number to be as low as possible.
Another option is measuring lost revenue instead of lost customers over a given period of time, called revenue churn rate. You can use two slightly different formulas to figure out revenue churn on a net or gross level.
Gross revenue churn = (Churned revenue in a given period / Monthly recurring revenue in the previous period) x 100
Net revenue churn = [(Churned revenue in a period – Expansion revenue) ÷ Monthly recurring revenue in the previous period] x 100
These percentages show you the effect of your existing customers on your bottom line.
You can also get even more granular by looking specifically at the monthly recurring revenue you lose.
To calculate your MRR churn rate, use the following formula:
MRR churn rate = [(downgraded MRR + cancelled MRR) - expanded MRR / total MRR at the beginning of the month] x 100
You actually want this number to be negative, because that means your expansions are greater than your downgrades or cancellations.
You’ll tabulate this market research measurement from survey responses from your customers. In the survey, you ask them on a scale of “unlikely” to “highly likely” what the chances are that they’d recommend your business to someone.
The more “likely” and "highly likely” votes the better: This means your customers are happy with their interactions with your brand, they’re likely to shop with you again, and they’ll bring their friends and family on board, too.
Also sometimes called repeat purchase rate or repeat purchase ratio, this metric gives you the percentage of your customers who have bought something from you at least twice.
You find this number by dividing the number of customers who made more than one purchase by your total number of customers in a given period of time. Multiply that number by 100. You want this number to be high.
A high repeat customer rate is a telltale sign of customer engagement. If this number is low, dig deeper and form hypotheses to test customer retention improvement strategies that may help.
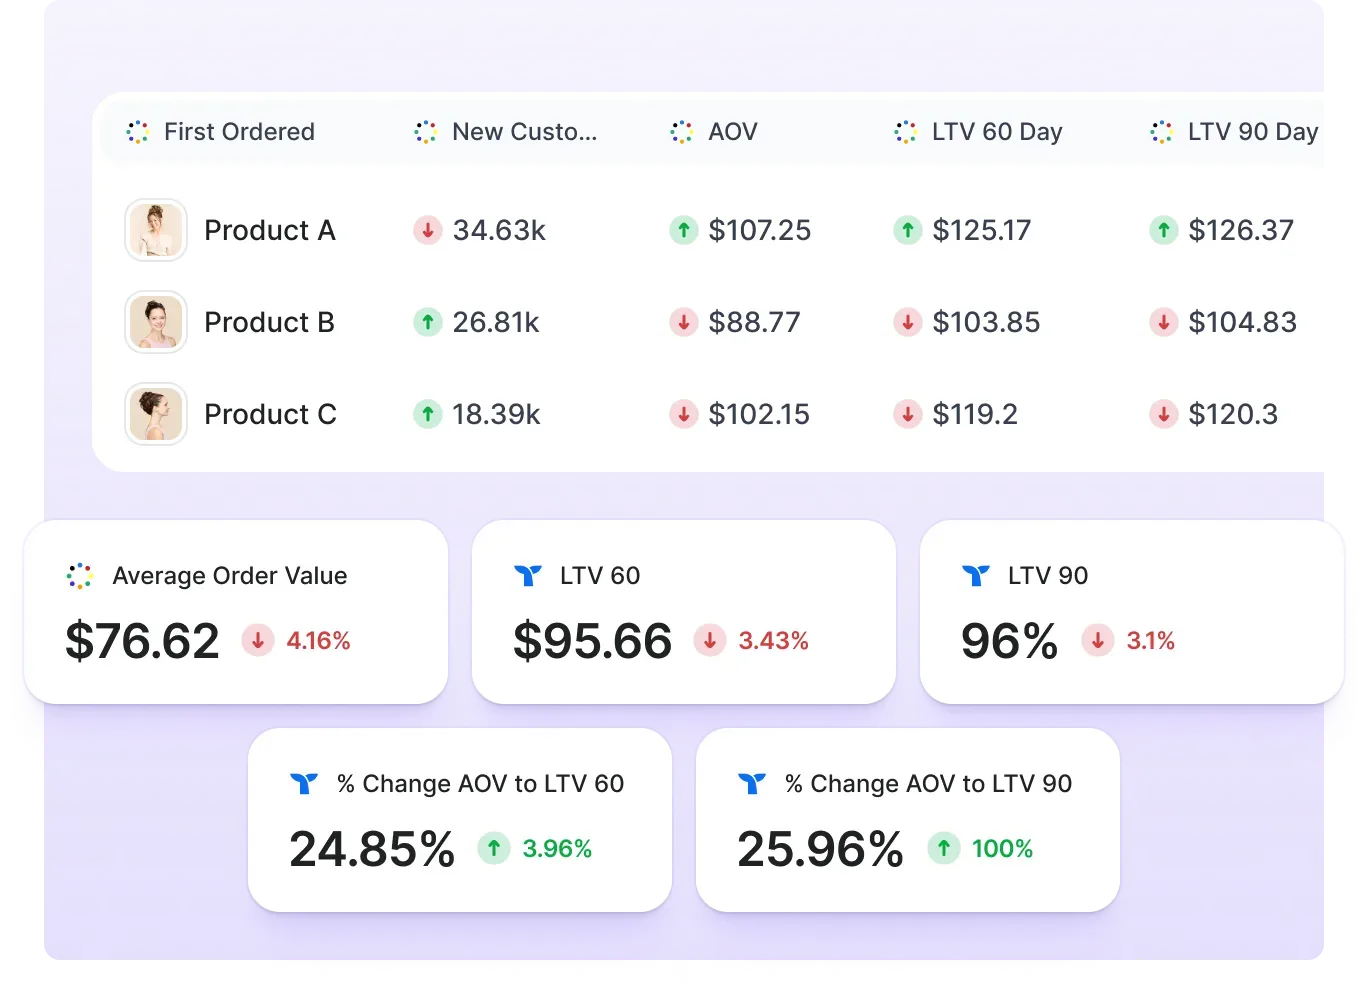
Customer lifetime value gives you a monetary value your average customer will spend on your business throughout their relationship with your brand.
You can calculate CLV at a business, customer service, or individual level by multiplying customer value by average customer lifespan. You want this number to be high. And if it’s not where you’d like it to be, you can use it to guide decisions about budget allocation for various improvements to your customer journey.
You might also decide to send a customer satisfaction survey to shoppers post-purchase to ask for feedback on their most recent interaction with your brand. A satisfaction survey typically asks customers to rank how satisfied they are with their shopping experience from 1 (not satisfied) to 5 (very satisfied). Of course, you want your average customer satisfaction score to be high as a signal of strong retention.
This metric measures how much difficulty an average shopper has interacting with your brand on a scale of 1 (easy) to 5 (very difficult), according to Harvard Business Review. An ideal CES is low, signaling customers find your site easy to navigate and have little trouble making purchases. A high CES might mean there are too many obstacles getting in the way of conversion.
Customer journey analytics can help you figure out where shoppers might be encountering some of these barriers and improve retention, conversion rate, and your bottom line.
This metric isn’t as simple to measure or track because you’ll have different benchmarks of success for different desired actions customers can take. But putting the time into understanding this measurement can help you make informed decisions as you iterate on products and features based on what you’ve learned about low- and high-engagement points in your sales funnel.
To start, you have to identify and track the specific engagement events you’re interested in, such as session duration, subscription upgrades, referrals, or community forum posts.
Triple Whale’s retention tools (including our AI agents for customer retention) can help you track these and other custom events to simplify the process. Then, assign a score to each event based on how important it is in the customer journey from 1 (least important) to 10 (most important).
Now you’re ready to plug all your numbers into this customer engagement score formula:
Customer engagement score = Event score x Number of times the event occurred in the given period
Ideally, you want this number to be high because that means your audience is actively engaged and more likely to stick around.
Triple Whale provides comprehensive customer engagement tracking by consolidating data from all your marketing channels and customer touch points into a unified dashboard. The platform monitors essential engagement metrics, including website sessions, user behavior (pages per session, session duration, bounce rates), conversion rates, and multi-channel attribution across all connected advertising platforms like Facebook, Google, TikTok, and email/SMS campaigns.
What sets Triple Whale apart is its use of server-side tracking with the Pixel, which captures more accurate first-party data compared to traditional analytics tools.
Beyond basic metrics, Triple Whale also excels at providing deeper engagement insights through advanced features like lifetime attribution windows, cross-channel customer journey mapping, and the ability to distinguish between new and returning customer engagement patterns.
The platform integrates with major email and SMS marketing tools (Klaviyo, Attentive, etc.) to track engagement from all communication channels.
This holistic approach to engagement tracking enables ecommerce businesses to understand not just individual channel performance, but how customers interact with their brand across the entire marketing ecosystem. This way, it’s easier to identify which touchpoints drive the most meaningful engagement and optimize accordingly.
You can use a number of different approaches to get as much information as possible from your retention analysis. Here are some of the most common methods to consider.
Cohort analysis measures the behavior of a specific group of customers over a period of time, usually 12 months. The goal is to not just understand what they want to buy, but when they buy, the marketing they respond to, and when in the customer lifecycle they might stop doing business with your brand.
Triple Whale’s cohort analysis tools can help you identify the month when users are most likely to drop subscriptions, the percentage of users who leave after their first month interacting with your brand, and other measures of retention (or churn).
Triple Whale’s Customer Cohorts Dashboard also analyzes customer acquisition costs (CAC) and how long it takes to achieve return on investment. Cohorts can also be customized with advanced segmentation and filtering, either by products, locations, discount codes, or attribution channels for a deeper analysis.
Within a specific customer cohort, you can then run periodic customer retention analysis, which tracks a certain activity or behavior over a period of time, like days, weeks, or months.
You’ll start by monitoring activity over that time period to get a total number of customers who were active then. Divide that number by the total number of customers in the cohort and multiply that number by 100 to get a percentage of active users during that period. This gives you a helpful picture of retention among certain users during a certain time, and you can easily compare this number to activity among other cohorts.
Think of retrospective customer retention analytics as the opposite of periodic customer retention analytics. With a retrospective approach, you’ll identify a period of time of inactivity that likely signifies churn. For example, maybe it’s been a month since a user has opened one of your marketing emails or 14 days since they’ve interacted with your Instagram content.
You can divide the number of inactive users during a certain time period by the total number of users in their cohort and multiply that number by 100 for the percentage of customers who have likely left your business. Then you can compare these rates with longer time intervals to see if you can identify key points in the sales funnel that may have turned them off and focus your attention there for lifecycle optimization.
This stands for recency, frequency, and monetary value. RFM segmentation is a common way of grouping customers as part of the customer segmentation process. After segmenting your visitors, you can analyze retention based on how customers rank along these three vectors. RFM analysis might group shoppers by new customers, high-risk customers, high-value customers, and low-value customers, for example.
Descriptive analysis relies on historical data and real-time trends to gain clear insights on how your customers are interacting with your brand and catch patterns across multiple measures of customer retention. It answers the question “What happened?”, according to Harvard Business School.
It can help you discover, for example, if a worryingly high percent of customers churn after their second interaction, which can then focus your attention on improving something going wrong at that point in your funnel.
You might use similar data sources in diagnostic analytics as you would in descriptive analytics. But with a diagnostic approach, you’ll attempt to answer the question “Why did this happen?”, per Harvard Business School. You start to find answers by coming up with various hypotheses and testing your theories to see if you can make meaningful changes to retention.
Predictive analytics for customer retention uses models and algorithms to—as the name suggests—predict how your audience might act or behave in the future. These predictions won’t necessarily come true, of course, but this kind of customer retention forecasting can help you plan your future marketing spend based on past trends and patterns.
Funnel analysis gives you a clear view of your customer journey and helps you identify drop-off points where customers churn or don’t convert. When you pinpoint these barriers, you can start taking steps to ease this friction, encouraging conversion and retention.
Once you’re more familiar with customer retention metrics and methods, it’s time to implement the step-by-step analysis process. While your analysis will take some time to finetune, it’s worth sticking with it—and don’t forget Triple Whale can help!
Decide which metrics from the list above are the most important for your business based on your industry, available data, and goals. These will become your personal KPIs for customer retention or how your business chooses to measure customer retention.
Then, use the formulas for those various metrics to calculate where you’re at in terms of retention so far. You can also use Triple Whale’s retention tools to seamlessly measure several different metrics at once.
Analytics, surveys, and other retention tools can help you assemble the necessary data on your customers and their behaviors for you to learn more about what’s driving their conversions (or their churn).
Categorize your customers based on shared characteristics like age, behaviors, spending habits, and preferences, called customer segmentation. Once you’ve identified these cohorts, you can drill down into what makes them tick.
Analyze the behaviors of each cohort or segment. Compare churn rate, repeat purchases, and other retention markers between segments, looking for patterns that tell you more about how your customers interact with your business. For example, maybe you discover that 30- to 45-year-old customers are more likely to unsubscribe from your email campaigns after receiving more than three messages in a month.
Then, craft some hypotheses about small changes you can make to help fight churn and support retention and put these tweaks into practice. That’s the whole point of customer retention analytics, after all—you want to be able to take action on the insights you’ve gleaned from the analysis process that help improve retention and long-term success.
Sticking with the example above, you might reduce your email frequency for millennial customers to once a month and monitor retention metrics for positive changes.
Customer retention analysis is not a set-it-and-forget-it process. To really capitalize on all the insights available to you, you should be continuously monitoring your KPIs, refining your hypotheses for improvement, and implementing more changes to support long-term profitability.
Customer retention analytics help you understand why, how, and when your customers stay loyal to your business. This analysis gives you an understanding of how effective your retention strategy is and the opportunities you might have to limit churn.
There are different retention metrics you can track depending on your goals. But however you decide to measure customer retention, you’ll likely want to segment your users, analyze these cohorts, and apply a number of different retention methods so you can get the most complete picture of your efforts, success, and opportunities for improvement.
And Triple Whale can help streamline the whole process. Our Moby Agents monitor purchase patterns, predict lifetime value, and surface personalized recommendations that keep your most valuable customers coming back. Book a demo today!
To start, that would be customer retention rate. The formula to calculate your CRR is:
Customer retention rate = ((Total number of customers at the end of a period of time - Number of new customers during that period) ÷ Number of customers at the start of the period) x 100
But it’s a smart idea to consider your CRR in the context of other key retention metrics like customer churn rate and customer lifetime value for a more complete understanding of your marketing efforts.
To understand why your customers remain loyal to your brand and why others leave for competitors. Customer retention analysis allows you to spot patterns in retention and churn that then help you identify opportunities to improve retention. And ultimately, when you improve retention, you improve profitability and growth.
It depends on your goal and your resources to conduct this type of analysis, but ideally you’d take a look monthly or quarterly. You might also analyze retention data related to a specific effort or campaign whenever that time period ends. Analyzing more frequently than monthly may not give you enough data to work with.
It’s no secret it’s less expensive to retain an existing customer than to it is acquire a new one. But you won’t know exactly how well your customer retention strategies are working without some careful customer retention analysis.
Keep reading to learn more about the retention analytics to pay attention to and how to conduct your analysis for the most helpful takeaways.
Customer retention is your business’s ability to keep your customers over time. A high retention rate drives higher customer lifetime value and long-term profitability. And customer retention analytics help you understand how effective your strategy is and where you might be able to make improvements.
Customer retention analytics or user retention analytics involves analyzing various metrics about your visitors and customers so you can better understand the driving factors behind their purchases, loyalty, and order value.
Analyzing your customer retention data can also help you understand what drives some users away without making more purchases, called customer churn. In other words, this process gives you a better sense of why some customers stick around and others bounce.
It involves monitoring a number of metrics and methods for tracking past customer behavior as well as some predictive analytics for forecasting future behavior, usually over a specific period of time and sometimes even among a certain segment of users.
Customer retention analytics is a process; there are multiple metrics worth tracking so you can get as complete a picture of your success as possible. Here are some of the key numbers to take a look at.
This metric gives you the percentage of your customers you retain over a specific period of time. You calculate it by subtracting your new customers during a certain time period from the total number of customers you have at the end of that period of time. Divide that number by your number of customers at the start of the period, and multiply that by 100.
You want your customer retention rate to be high; that means more of your customers are sticking with you and making repeat purchases, which is, of course, good for business.
Customer churn rate, on the other hand, is basically the opposite of your customer retention rate. This metric tells you the percentage of your customers who have left your business over a period of time. Customer churn analysis can help you figure out what’s driving users away and make adjustments to improve your score.
You can calculate yours by dividing the number of customers who left over a specific time period by your total number of customers at the start of that period, and then multiplying that number by 100. You want this number to be as low as possible.
Another option is measuring lost revenue instead of lost customers over a given period of time, called revenue churn rate. You can use two slightly different formulas to figure out revenue churn on a net or gross level.
Gross revenue churn = (Churned revenue in a given period / Monthly recurring revenue in the previous period) x 100
Net revenue churn = [(Churned revenue in a period – Expansion revenue) ÷ Monthly recurring revenue in the previous period] x 100
These percentages show you the effect of your existing customers on your bottom line.
You can also get even more granular by looking specifically at the monthly recurring revenue you lose.
To calculate your MRR churn rate, use the following formula:
MRR churn rate = [(downgraded MRR + cancelled MRR) - expanded MRR / total MRR at the beginning of the month] x 100
You actually want this number to be negative, because that means your expansions are greater than your downgrades or cancellations.
You’ll tabulate this market research measurement from survey responses from your customers. In the survey, you ask them on a scale of “unlikely” to “highly likely” what the chances are that they’d recommend your business to someone.
The more “likely” and "highly likely” votes the better: This means your customers are happy with their interactions with your brand, they’re likely to shop with you again, and they’ll bring their friends and family on board, too.
Also sometimes called repeat purchase rate or repeat purchase ratio, this metric gives you the percentage of your customers who have bought something from you at least twice.
You find this number by dividing the number of customers who made more than one purchase by your total number of customers in a given period of time. Multiply that number by 100. You want this number to be high.
A high repeat customer rate is a telltale sign of customer engagement. If this number is low, dig deeper and form hypotheses to test customer retention improvement strategies that may help.
Customer lifetime value gives you a monetary value your average customer will spend on your business throughout their relationship with your brand.
You can calculate CLV at a business, customer service, or individual level by multiplying customer value by average customer lifespan. You want this number to be high. And if it’s not where you’d like it to be, you can use it to guide decisions about budget allocation for various improvements to your customer journey.
You might also decide to send a customer satisfaction survey to shoppers post-purchase to ask for feedback on their most recent interaction with your brand. A satisfaction survey typically asks customers to rank how satisfied they are with their shopping experience from 1 (not satisfied) to 5 (very satisfied). Of course, you want your average customer satisfaction score to be high as a signal of strong retention.
This metric measures how much difficulty an average shopper has interacting with your brand on a scale of 1 (easy) to 5 (very difficult), according to Harvard Business Review. An ideal CES is low, signaling customers find your site easy to navigate and have little trouble making purchases. A high CES might mean there are too many obstacles getting in the way of conversion.
Customer journey analytics can help you figure out where shoppers might be encountering some of these barriers and improve retention, conversion rate, and your bottom line.
This metric isn’t as simple to measure or track because you’ll have different benchmarks of success for different desired actions customers can take. But putting the time into understanding this measurement can help you make informed decisions as you iterate on products and features based on what you’ve learned about low- and high-engagement points in your sales funnel.
To start, you have to identify and track the specific engagement events you’re interested in, such as session duration, subscription upgrades, referrals, or community forum posts.
Triple Whale’s retention tools (including our AI agents for customer retention) can help you track these and other custom events to simplify the process. Then, assign a score to each event based on how important it is in the customer journey from 1 (least important) to 10 (most important).
Now you’re ready to plug all your numbers into this customer engagement score formula:
Customer engagement score = Event score x Number of times the event occurred in the given period
Ideally, you want this number to be high because that means your audience is actively engaged and more likely to stick around.
Triple Whale provides comprehensive customer engagement tracking by consolidating data from all your marketing channels and customer touch points into a unified dashboard. The platform monitors essential engagement metrics, including website sessions, user behavior (pages per session, session duration, bounce rates), conversion rates, and multi-channel attribution across all connected advertising platforms like Facebook, Google, TikTok, and email/SMS campaigns.
What sets Triple Whale apart is its use of server-side tracking with the Pixel, which captures more accurate first-party data compared to traditional analytics tools.
Beyond basic metrics, Triple Whale also excels at providing deeper engagement insights through advanced features like lifetime attribution windows, cross-channel customer journey mapping, and the ability to distinguish between new and returning customer engagement patterns.
The platform integrates with major email and SMS marketing tools (Klaviyo, Attentive, etc.) to track engagement from all communication channels.
This holistic approach to engagement tracking enables ecommerce businesses to understand not just individual channel performance, but how customers interact with their brand across the entire marketing ecosystem. This way, it’s easier to identify which touchpoints drive the most meaningful engagement and optimize accordingly.
You can use a number of different approaches to get as much information as possible from your retention analysis. Here are some of the most common methods to consider.
Cohort analysis measures the behavior of a specific group of customers over a period of time, usually 12 months. The goal is to not just understand what they want to buy, but when they buy, the marketing they respond to, and when in the customer lifecycle they might stop doing business with your brand.
Triple Whale’s cohort analysis tools can help you identify the month when users are most likely to drop subscriptions, the percentage of users who leave after their first month interacting with your brand, and other measures of retention (or churn).
Triple Whale’s Customer Cohorts Dashboard also analyzes customer acquisition costs (CAC) and how long it takes to achieve return on investment. Cohorts can also be customized with advanced segmentation and filtering, either by products, locations, discount codes, or attribution channels for a deeper analysis.
Within a specific customer cohort, you can then run periodic customer retention analysis, which tracks a certain activity or behavior over a period of time, like days, weeks, or months.
You’ll start by monitoring activity over that time period to get a total number of customers who were active then. Divide that number by the total number of customers in the cohort and multiply that number by 100 to get a percentage of active users during that period. This gives you a helpful picture of retention among certain users during a certain time, and you can easily compare this number to activity among other cohorts.
Think of retrospective customer retention analytics as the opposite of periodic customer retention analytics. With a retrospective approach, you’ll identify a period of time of inactivity that likely signifies churn. For example, maybe it’s been a month since a user has opened one of your marketing emails or 14 days since they’ve interacted with your Instagram content.
You can divide the number of inactive users during a certain time period by the total number of users in their cohort and multiply that number by 100 for the percentage of customers who have likely left your business. Then you can compare these rates with longer time intervals to see if you can identify key points in the sales funnel that may have turned them off and focus your attention there for lifecycle optimization.
This stands for recency, frequency, and monetary value. RFM segmentation is a common way of grouping customers as part of the customer segmentation process. After segmenting your visitors, you can analyze retention based on how customers rank along these three vectors. RFM analysis might group shoppers by new customers, high-risk customers, high-value customers, and low-value customers, for example.
Descriptive analysis relies on historical data and real-time trends to gain clear insights on how your customers are interacting with your brand and catch patterns across multiple measures of customer retention. It answers the question “What happened?”, according to Harvard Business School.
It can help you discover, for example, if a worryingly high percent of customers churn after their second interaction, which can then focus your attention on improving something going wrong at that point in your funnel.
You might use similar data sources in diagnostic analytics as you would in descriptive analytics. But with a diagnostic approach, you’ll attempt to answer the question “Why did this happen?”, per Harvard Business School. You start to find answers by coming up with various hypotheses and testing your theories to see if you can make meaningful changes to retention.
Predictive analytics for customer retention uses models and algorithms to—as the name suggests—predict how your audience might act or behave in the future. These predictions won’t necessarily come true, of course, but this kind of customer retention forecasting can help you plan your future marketing spend based on past trends and patterns.
Funnel analysis gives you a clear view of your customer journey and helps you identify drop-off points where customers churn or don’t convert. When you pinpoint these barriers, you can start taking steps to ease this friction, encouraging conversion and retention.
Once you’re more familiar with customer retention metrics and methods, it’s time to implement the step-by-step analysis process. While your analysis will take some time to finetune, it’s worth sticking with it—and don’t forget Triple Whale can help!
Decide which metrics from the list above are the most important for your business based on your industry, available data, and goals. These will become your personal KPIs for customer retention or how your business chooses to measure customer retention.
Then, use the formulas for those various metrics to calculate where you’re at in terms of retention so far. You can also use Triple Whale’s retention tools to seamlessly measure several different metrics at once.
Analytics, surveys, and other retention tools can help you assemble the necessary data on your customers and their behaviors for you to learn more about what’s driving their conversions (or their churn).
Categorize your customers based on shared characteristics like age, behaviors, spending habits, and preferences, called customer segmentation. Once you’ve identified these cohorts, you can drill down into what makes them tick.
Analyze the behaviors of each cohort or segment. Compare churn rate, repeat purchases, and other retention markers between segments, looking for patterns that tell you more about how your customers interact with your business. For example, maybe you discover that 30- to 45-year-old customers are more likely to unsubscribe from your email campaigns after receiving more than three messages in a month.
Then, craft some hypotheses about small changes you can make to help fight churn and support retention and put these tweaks into practice. That’s the whole point of customer retention analytics, after all—you want to be able to take action on the insights you’ve gleaned from the analysis process that help improve retention and long-term success.
Sticking with the example above, you might reduce your email frequency for millennial customers to once a month and monitor retention metrics for positive changes.
Customer retention analysis is not a set-it-and-forget-it process. To really capitalize on all the insights available to you, you should be continuously monitoring your KPIs, refining your hypotheses for improvement, and implementing more changes to support long-term profitability.
Customer retention analytics help you understand why, how, and when your customers stay loyal to your business. This analysis gives you an understanding of how effective your retention strategy is and the opportunities you might have to limit churn.
There are different retention metrics you can track depending on your goals. But however you decide to measure customer retention, you’ll likely want to segment your users, analyze these cohorts, and apply a number of different retention methods so you can get the most complete picture of your efforts, success, and opportunities for improvement.
And Triple Whale can help streamline the whole process. Our Moby Agents monitor purchase patterns, predict lifetime value, and surface personalized recommendations that keep your most valuable customers coming back. Book a demo today!
To start, that would be customer retention rate. The formula to calculate your CRR is:
Customer retention rate = ((Total number of customers at the end of a period of time - Number of new customers during that period) ÷ Number of customers at the start of the period) x 100
But it’s a smart idea to consider your CRR in the context of other key retention metrics like customer churn rate and customer lifetime value for a more complete understanding of your marketing efforts.
To understand why your customers remain loyal to your brand and why others leave for competitors. Customer retention analysis allows you to spot patterns in retention and churn that then help you identify opportunities to improve retention. And ultimately, when you improve retention, you improve profitability and growth.
It depends on your goal and your resources to conduct this type of analysis, but ideally you’d take a look monthly or quarterly. You might also analyze retention data related to a specific effort or campaign whenever that time period ends. Analyzing more frequently than monthly may not give you enough data to work with.
.webp)

Body Copy: The following benchmarks compare advertising metrics from April 1-17 to the previous period. Considering President Trump first unveiled his tariffs on April 2, the timing corresponds with potential changes in advertising behavior among ecommerce brands (though it isn’t necessarily correlated).


.webp)

.webp)


.png)


.png)
