


Meta’s Facebook (and Instagram) remain one of the most powerful and favored ad platforms for ecommerce businesses, and the 3.35 billion monthly active users (as of Q4 2024) are a main reason why. But a compelling ad is only the first step, and running a successful campaign requires a deep understanding of Facebook ad analytics to measure performance, optimize campaigns, and maximize return on investment.
Facebook ads have evolved dramatically over the past few years, especially post iOS 14.5 privacy changes that introduced a limitation for tracking capabilities. The more complex marketing environment means that marketers must leverage new analytics tools and strategies in order to run the most effective campaigns and complete a Facebook ads audit.
In this guide, we’ll walk through everything you need to know about Facebook ad analytics, from understanding key metrics to implementing data-driven optimization strategies that deliver measurable results.
Before diving into specific metrics, it’s important to clarify that ‘Facebook ad analytics” isn’t the name of a specific tool. Rather, it’s a comprehensive term that encompasses the various metrics, reports, and analytical approaches used to track and evaluate Facebook advertising campaign performance.
The primary tool for accessing Facebook analytics is Meta Ads Manager (formerly Facebook Ads Manager), which serves as the central hub for creating, managing, and analyzing your Facebook and Instagram ad campaigns. This platform provides access to hundreds of different metrics and reporting capabilities that help advertisers understand campaign performance.
Key components of Facebook ad analytics include:
Understanding these analytics is crucial for making informed decisions about budget allocation, audience targeting, creative optimization, and overall campaign strategy.
Meta Ads Manager offers access to more than 350 different metrics, which can be overwhelming for advertisers trying to focus on what matters most. Here are the essential metrics organized by category to help you prioritize your analysis:
Meta Ads Manager is your primary tool for tracking Facebook ad analytics. Here’s how to access and customize your reporting:
Accessing Meta Ads Manager:
Customizing Your View:
Setting Up Key Metrics:
For Hook Rate:
For Hold Rate:
Meta Pixel and Conversions API
Meta's integration with Google Analytics provides expanded insight into how campaigns drive traffic and user activity. This integration, combined with the Meta Pixel and Conversions API, offers more comprehensive attribution data.
Meta is improving its ads creation interface by providing one-click options for suggested UTM parameters, helping identify traffic sources in Google Analytics. Proper UTM tagging ensures accurate attribution across platforms.
Limitations of Native Meta Reporting:
While Meta Ads Manager provides comprehensive native analytics, Triple Whale offers an enhanced approach to Facebook ad tracking that addresses many of the platform’s limitations while providing additional insights and automation.
Enhanced setup and integration
Unlike Meta’s isolated reporting, Triple Whale connects directly to your Meta Ads Manager account, automatically importing all campaign data without requiring manual exports or complex configurations. The platform combines Facebook ad data with other marketing channels, providing a unified view of your entire marketing performance. You can connect up to 20 Meta ad accounts to a single Triple Whale account, making it ideal for agencies managing multiple clients.
Superior data accuracy
Advanced analytics capabilities
Advantages over native tracking
This comprehensive approach to Facebook ad analytics enables more informed decision-making and can lead to significant improvements in campaign performance and ROI through enhanced data accuracy and advanced attribution modeling.
1. Define Clear Objectives
Before launching campaigns, establish specific, measurable goals that align with your business objectives. Different campaign types require different primary metrics:
2. Implement Proper Attribution
To minimize discrepancies between Facebook and Google Analytics, exclude view-through conversions in Facebook attribution settings and focus on click-through conversions.
3. Use Breakdowns for Deeper Insights
Utilize Facebook's breakdown options to analyze performance by:
1. Creative Performance Analysis Facebook and Instagram are extremely visual platforms, and the quality of your ad creative is going to matter more and more. Regularly analyze which creative elements drive the best performance:
2. Audience Refinement. Many advertisers now report better results with broad targeting using Meta's AI optimization. Consider:
3. Budget Optimization. Monitor performance trends to inform budget allocation:
Daily Monitoring:
Weekly Analysis:
Monthly Deep Dive:
While Meta Ads Manager provides comprehensive native analytics, third-party tools can enhance your analysis capabilities:
Benefits of Enhanced Analytics:
Key Features to Look For:
Meta Ads Manager continues to evolve, with new features, policy changes, and technological advancements in 2025. To maintain effective analytics practices:
Mastering Facebook ad analytics is essential for maximizing the effectiveness of your advertising investment. To evaluate the effectiveness of Facebook ads, focus on the right metrics, implement proper tracking, and follow data-driven optimization strategies. This way, you can significantly improve your campaign performance and ROI.
The key to success lies in understanding that analytics is an ongoing process, not a one-time setup. Continuously monitor your campaigns, test new approaches, and adapt to platform changes to stay ahead of the competition.
Remember that the most important metric is the one that directly ties to your business objectives. Whether that's driving website traffic, generating leads, or increasing sales, let your goals guide your analytics focus and optimization efforts.
Ready to take your Facebook advertising to the next level? Consider implementing advanced attribution solutions and comprehensive analytics platforms that can provide deeper insights into your campaign performance across all marketing channels. The investment in proper measurement and analytics will pay dividends in improved campaign performance and business growth.
Meta’s Facebook (and Instagram) remain one of the most powerful and favored ad platforms for ecommerce businesses, and the 3.35 billion monthly active users (as of Q4 2024) are a main reason why. But a compelling ad is only the first step, and running a successful campaign requires a deep understanding of Facebook ad analytics to measure performance, optimize campaigns, and maximize return on investment.
Facebook ads have evolved dramatically over the past few years, especially post iOS 14.5 privacy changes that introduced a limitation for tracking capabilities. The more complex marketing environment means that marketers must leverage new analytics tools and strategies in order to run the most effective campaigns and complete a Facebook ads audit.
In this guide, we’ll walk through everything you need to know about Facebook ad analytics, from understanding key metrics to implementing data-driven optimization strategies that deliver measurable results.
Before diving into specific metrics, it’s important to clarify that ‘Facebook ad analytics” isn’t the name of a specific tool. Rather, it’s a comprehensive term that encompasses the various metrics, reports, and analytical approaches used to track and evaluate Facebook advertising campaign performance.
The primary tool for accessing Facebook analytics is Meta Ads Manager (formerly Facebook Ads Manager), which serves as the central hub for creating, managing, and analyzing your Facebook and Instagram ad campaigns. This platform provides access to hundreds of different metrics and reporting capabilities that help advertisers understand campaign performance.
Key components of Facebook ad analytics include:
Understanding these analytics is crucial for making informed decisions about budget allocation, audience targeting, creative optimization, and overall campaign strategy.
Meta Ads Manager offers access to more than 350 different metrics, which can be overwhelming for advertisers trying to focus on what matters most. Here are the essential metrics organized by category to help you prioritize your analysis:
Meta Ads Manager is your primary tool for tracking Facebook ad analytics. Here’s how to access and customize your reporting:
Accessing Meta Ads Manager:
Customizing Your View:
Setting Up Key Metrics:
For Hook Rate:
For Hold Rate:
Meta Pixel and Conversions API
Meta's integration with Google Analytics provides expanded insight into how campaigns drive traffic and user activity. This integration, combined with the Meta Pixel and Conversions API, offers more comprehensive attribution data.
Meta is improving its ads creation interface by providing one-click options for suggested UTM parameters, helping identify traffic sources in Google Analytics. Proper UTM tagging ensures accurate attribution across platforms.
Limitations of Native Meta Reporting:
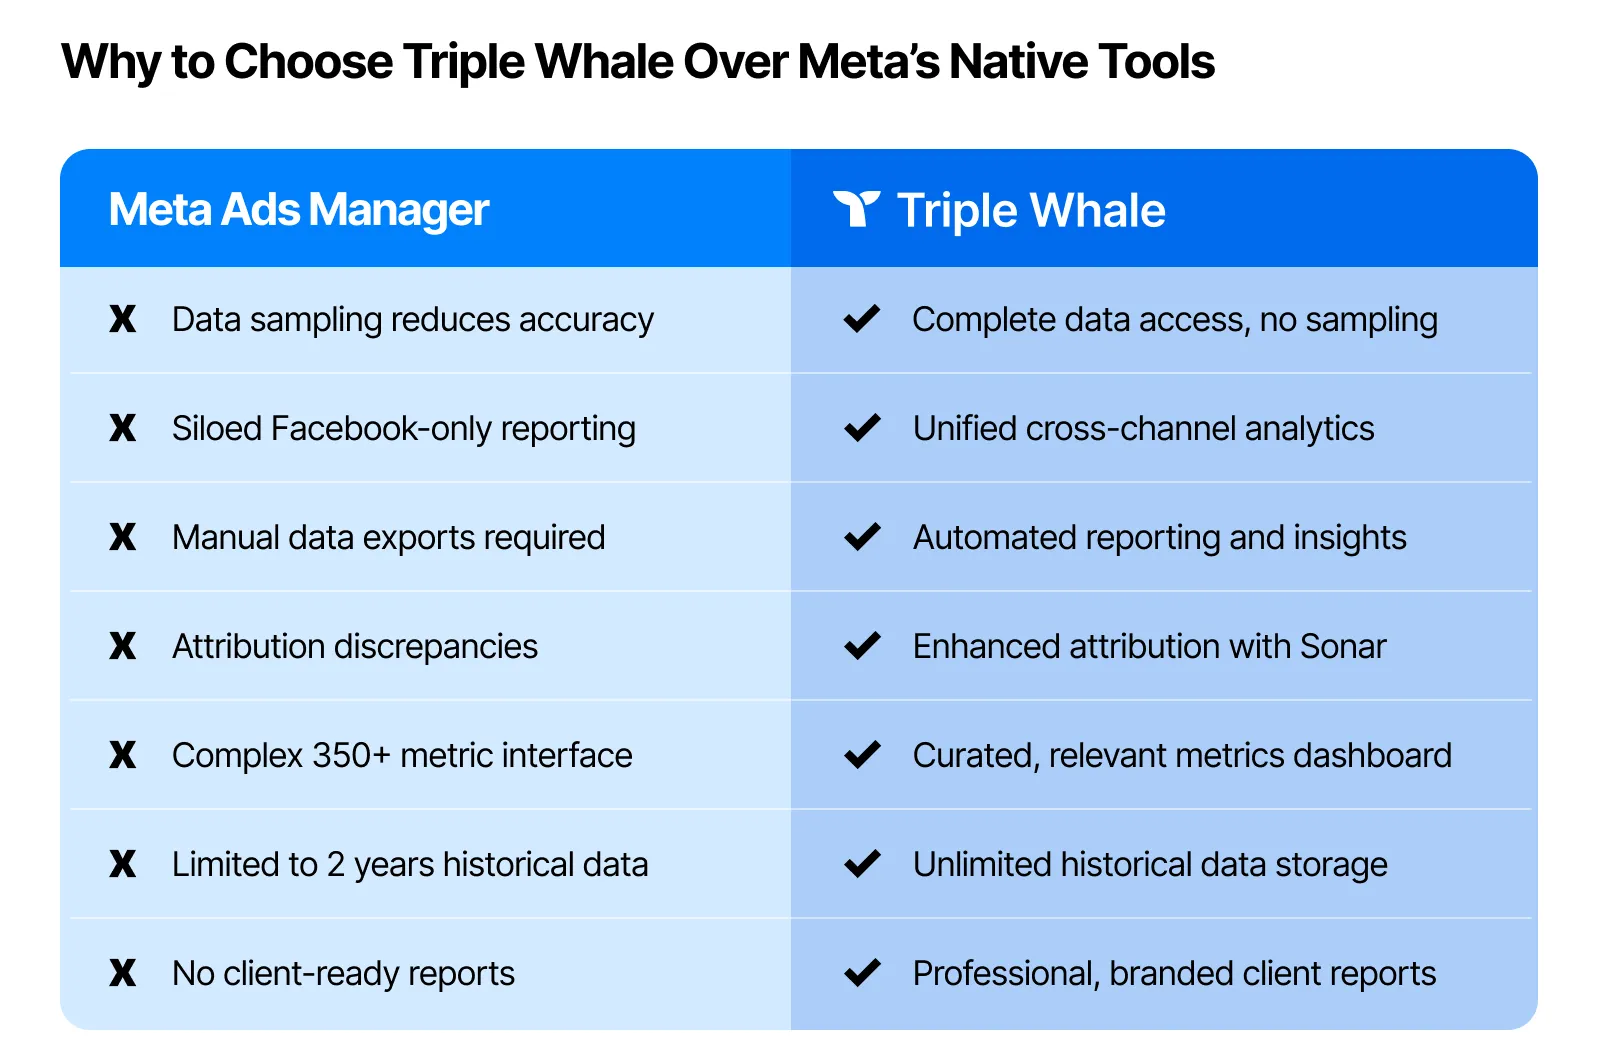
While Meta Ads Manager provides comprehensive native analytics, Triple Whale offers an enhanced approach to Facebook ad tracking that addresses many of the platform’s limitations while providing additional insights and automation.
Enhanced setup and integration
Unlike Meta’s isolated reporting, Triple Whale connects directly to your Meta Ads Manager account, automatically importing all campaign data without requiring manual exports or complex configurations. The platform combines Facebook ad data with other marketing channels, providing a unified view of your entire marketing performance. You can connect up to 20 Meta ad accounts to a single Triple Whale account, making it ideal for agencies managing multiple clients.
Superior data accuracy
Advanced analytics capabilities
Advantages over native tracking
This comprehensive approach to Facebook ad analytics enables more informed decision-making and can lead to significant improvements in campaign performance and ROI through enhanced data accuracy and advanced attribution modeling.
1. Define Clear Objectives
Before launching campaigns, establish specific, measurable goals that align with your business objectives. Different campaign types require different primary metrics:
2. Implement Proper Attribution
To minimize discrepancies between Facebook and Google Analytics, exclude view-through conversions in Facebook attribution settings and focus on click-through conversions.
3. Use Breakdowns for Deeper Insights
Utilize Facebook's breakdown options to analyze performance by:
1. Creative Performance Analysis Facebook and Instagram are extremely visual platforms, and the quality of your ad creative is going to matter more and more. Regularly analyze which creative elements drive the best performance:
2. Audience Refinement. Many advertisers now report better results with broad targeting using Meta's AI optimization. Consider:
3. Budget Optimization. Monitor performance trends to inform budget allocation:
Daily Monitoring:
Weekly Analysis:
Monthly Deep Dive:
While Meta Ads Manager provides comprehensive native analytics, third-party tools can enhance your analysis capabilities:
Benefits of Enhanced Analytics:
Key Features to Look For:
Meta Ads Manager continues to evolve, with new features, policy changes, and technological advancements in 2025. To maintain effective analytics practices:
Mastering Facebook ad analytics is essential for maximizing the effectiveness of your advertising investment. To evaluate the effectiveness of Facebook ads, focus on the right metrics, implement proper tracking, and follow data-driven optimization strategies. This way, you can significantly improve your campaign performance and ROI.
The key to success lies in understanding that analytics is an ongoing process, not a one-time setup. Continuously monitor your campaigns, test new approaches, and adapt to platform changes to stay ahead of the competition.
Remember that the most important metric is the one that directly ties to your business objectives. Whether that's driving website traffic, generating leads, or increasing sales, let your goals guide your analytics focus and optimization efforts.
Ready to take your Facebook advertising to the next level? Consider implementing advanced attribution solutions and comprehensive analytics platforms that can provide deeper insights into your campaign performance across all marketing channels. The investment in proper measurement and analytics will pay dividends in improved campaign performance and business growth.


Body Copy: The following benchmarks compare advertising metrics from April 1-17 to the previous period. Considering President Trump first unveiled his tariffs on April 2, the timing corresponds with potential changes in advertising behavior among ecommerce brands (though it isn’t necessarily correlated).


.webp)

.webp)


.png)


.jpg)

.png)
