


Measurement’s gotten a lot messier lately. Privacy changes hide a big chunk of user-level data, last-click misses a ton of upper-funnel value, and platform reports still can’t tell you what ads actually caused lift.
That’s why GeoLift is in the spotlight.
In this guide, you’ll learn what GeoLift experiments are — their benefits, their challenges, examples, and more. So let’s dive straight in.
GeoLift incrementality testing, also known as geo testing or geo-based experiments, helps marketers estimate the true impact of advertising across different regions.
Instead of relying on user-level data, GeoLift measures incrementality at the market level by comparing regions that were exposed to a campaign or spend change against regions that were not.
GeoLift then compares outcomes between those groups to calculate incremental lift — performance attributable to advertising, not to other forces like:
For example, let’s suppose you want to validate whether a new YouTube campaign is truly additive. You run the campaign in 10 treatment designated market areas (DMAs) and exclude 10 closely matched DMAs as controls.
After four to six weeks, GeoLift shows the campaign is generating incremental sales beyond what attribution suggested — giving you a validated, reliable signal to scale your YouTube spend with greater confidence.
Meta GeoLift is an “open source solution from Meta Open Source to calculate lift at a geo-level.” It is not a native Meta product feature.
Meta has published its own geolift documentation and tools for teams who want to run GeoLift experiments using that library directly, typically with support from analysts or data teams.
Triple Whale GeoLift experiments use the same GeoLift-style methodology, but package it into a workflow inside Unified Measurement. With it, you have the power to design and run geo experiments across Meta, Google, YouTube, and other channels.
That said, this guide focuses on running GeoLift through Triple Whale, but the principles apply anywhere you run geo experiments. And as geo-based incrementality testing keeps growing in popularity, understanding GeoLift in any capacity is becoming a must-have skill for modern marketers.
There’s a lot to be said about geo experiments, but here are the four biggest benefits marketers get from GeoLift-style incrementality testing.
With growing blind spots in traditional marketing attribution (zero-click search, social platforms, LLM-driven discovery, and more), GeoLift gives you a way to measure impact without relying on those noisy paths.
It doesn’t need last-click, view-through, or platform-reported conversions — by comparing treatment markets to a matched synthetic control, you observe lift directly in real outcomes.
Because GeoLift measures what changes in a region, it captures the total effect of marketing in that market — including spillover from other channels.
That makes it useful not only for Meta ads, but also for campaigns that run across platforms or even offline media, where cross-channel incrementality is the real question.
GeoLift estimates the delta between what actually happened and what would have happened anyway.
So your lift reflects true incremental sales or conversions, rather than correlation artifacts like organic demand, returning customers, seasonality, or halo effects that attribution often mis-assigns.
GeoLift doesn’t rely on user-level identifiers or personal data, so it stays reliable through privacy shifts like ATT, cookie loss, or future regulation.
As long as you have solid geo-level KPIs and spend data, you can run tests for almost any initiative — across markets, media types, and business models.
Before you think about setup, it helps to understand a few key terms. Once these click, the rest of GeoLift feels much less mysterious. The key ideas are:
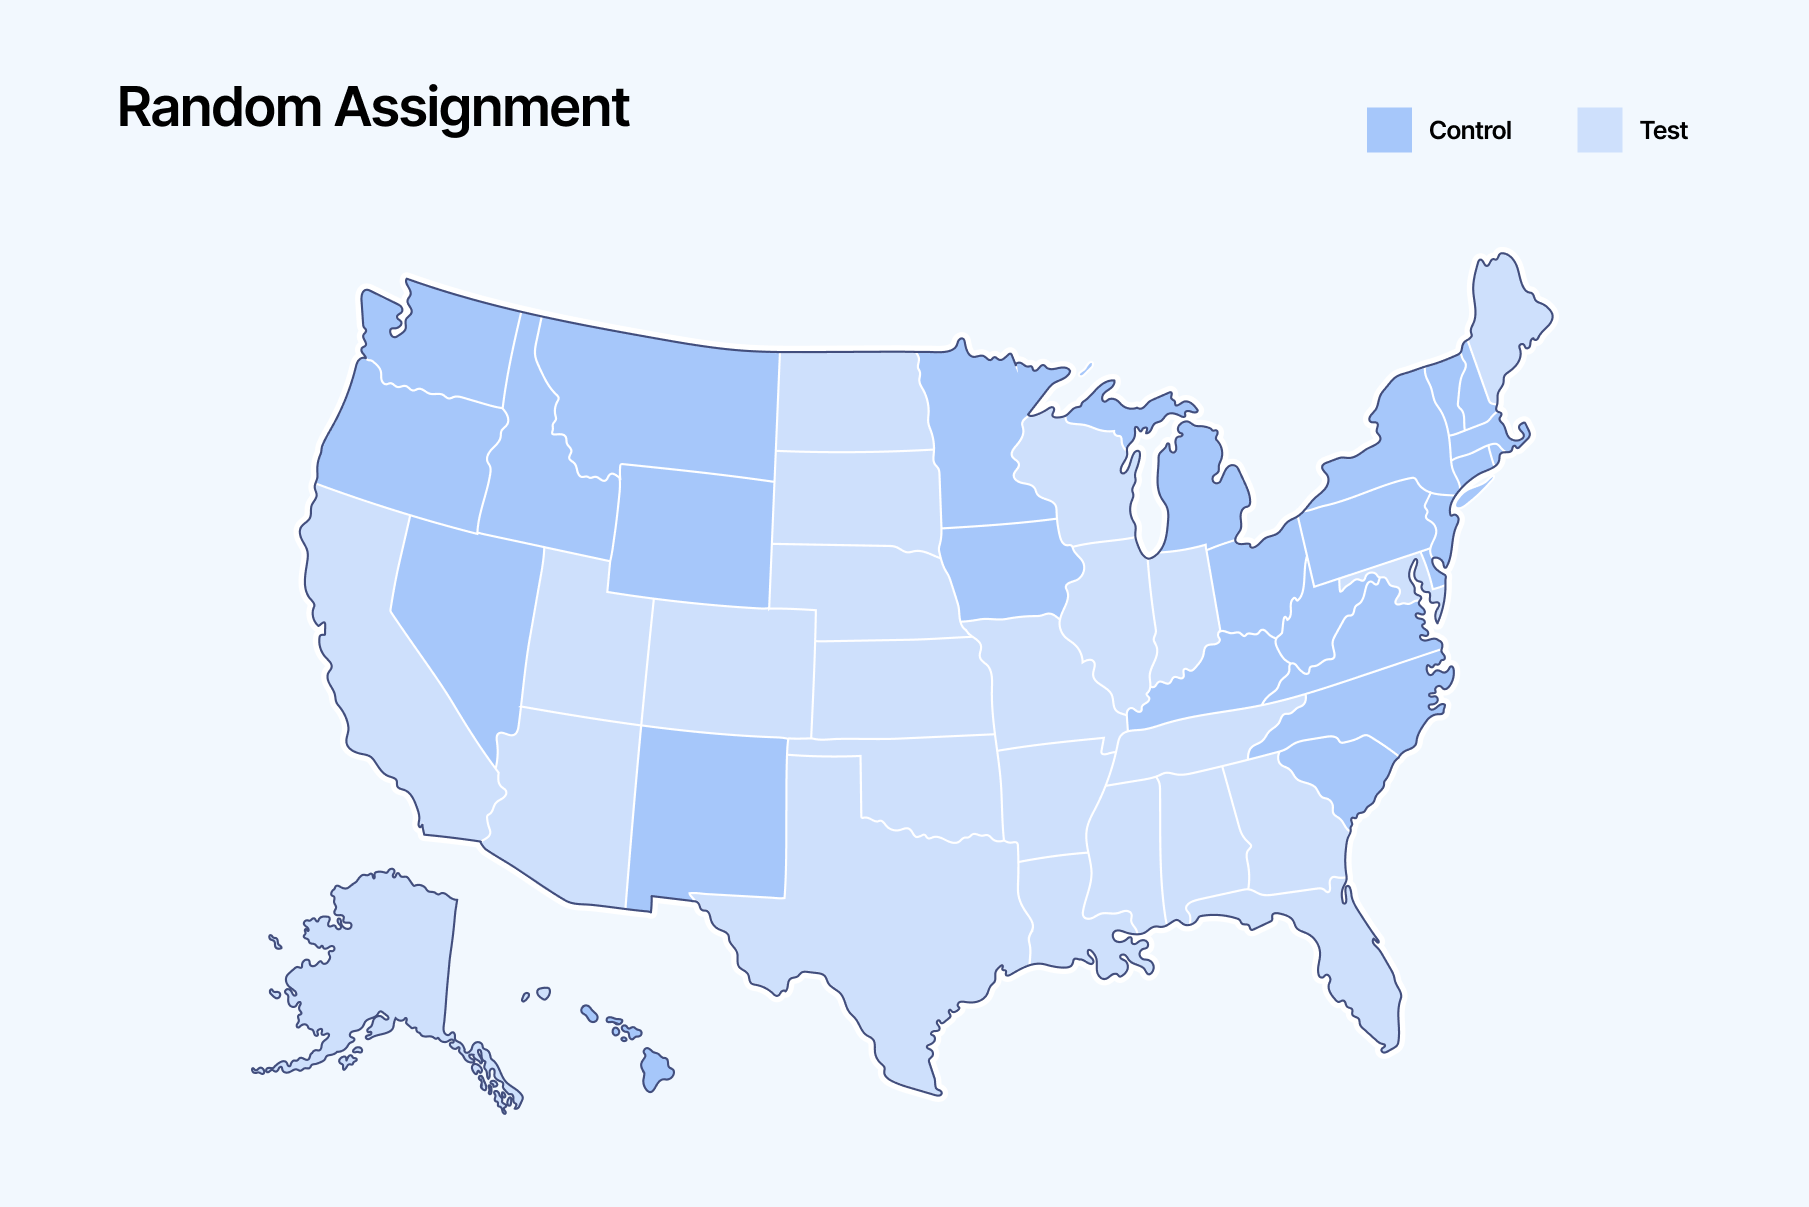
GeoLift works by running a controlled experiment across geographic regions like DMAs, states, or zip codes — although, we recommend running them across DMAs (more on that later).
You split markets into two groups:
The more closely these markets match on historical performance and trend, the cleaner the comparison. How you go about matching the markets is considered the “testing environment.”
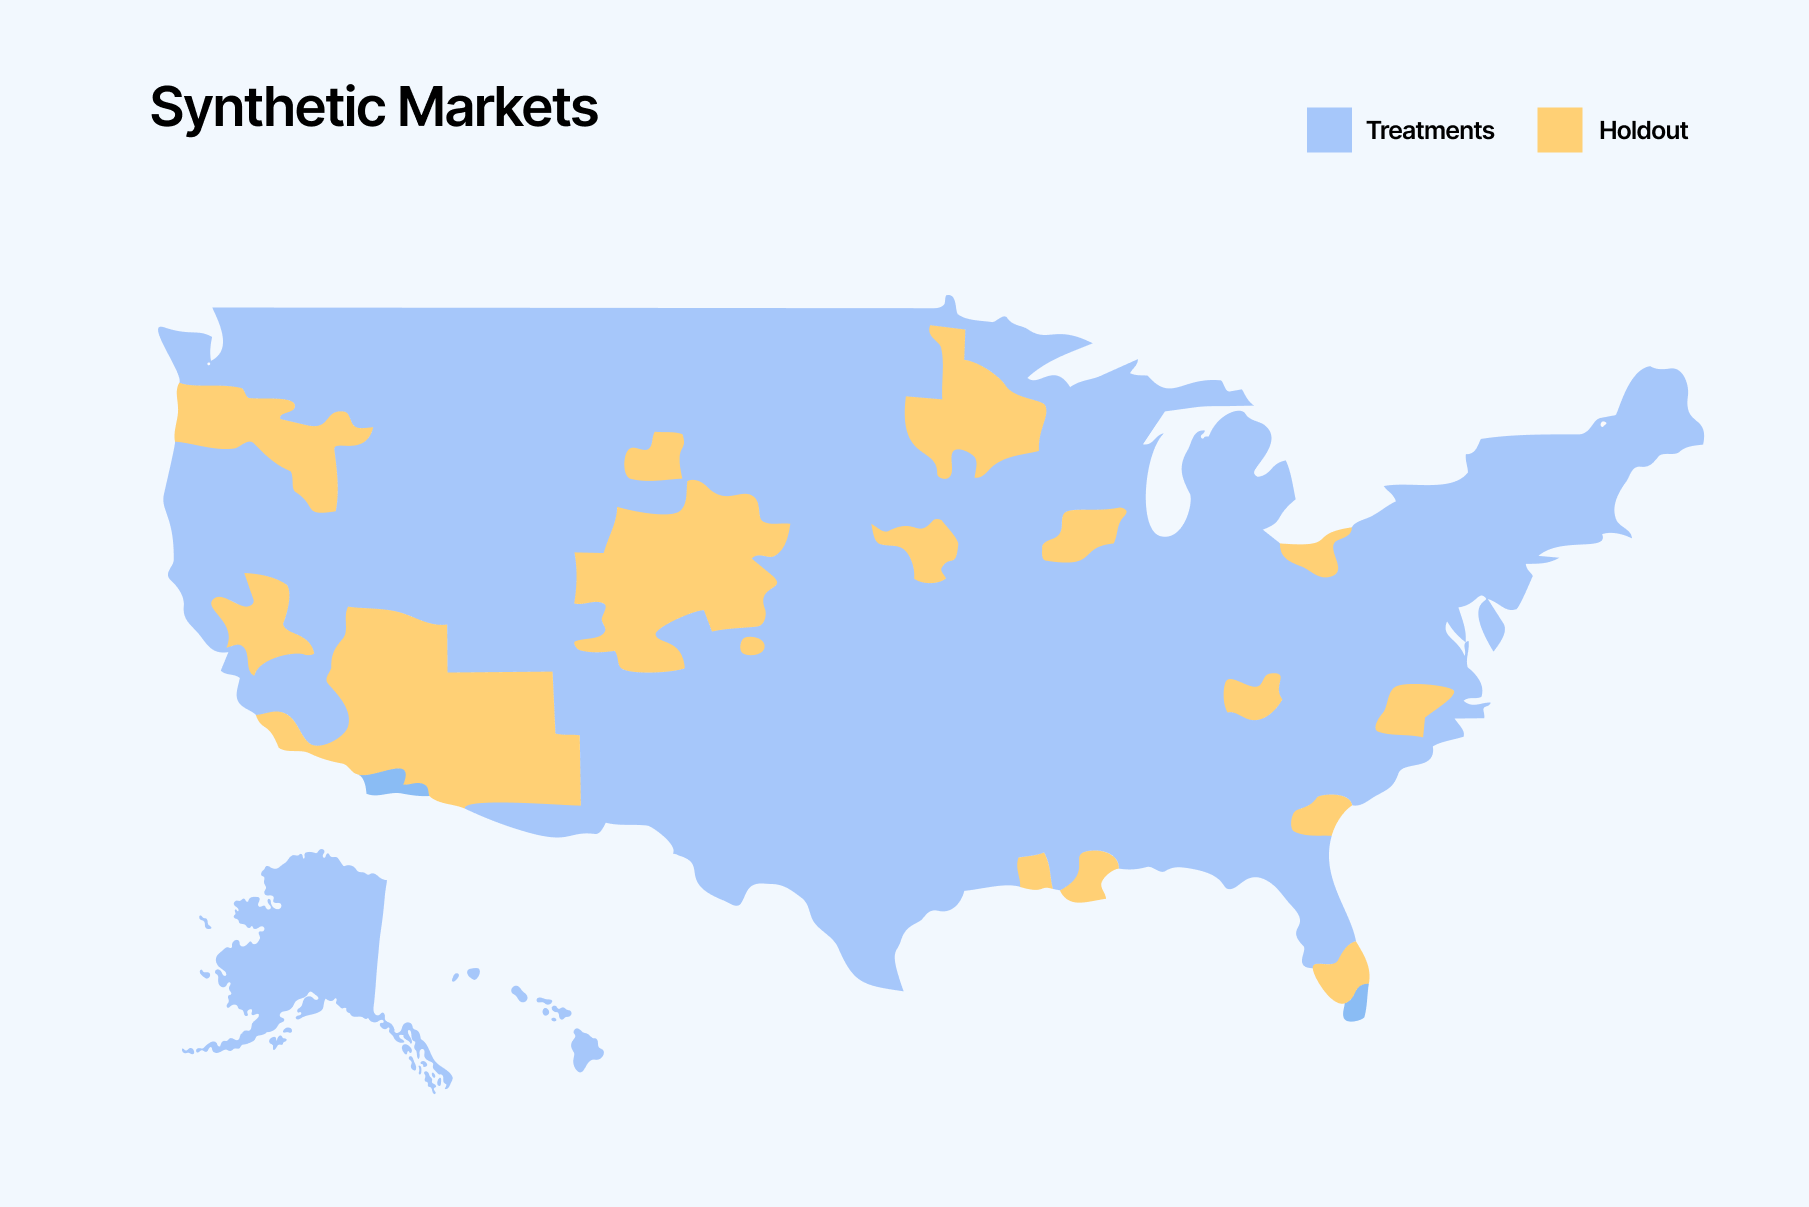
This synthetic control represents the “what would have happened anyway” baseline. The gap between actual treatment performance and that counterfactual is your incremental lift.
This is a simulation that runs before launch to estimate whether you’re likely to detect lift and how wide your confidence intervals might be. High-confidence designs usually need more time, markets, or a bigger spend change.
Results are typically reported using these terms inside your dashboard:
GeoLift isn’t something you run for every campaign. It’s best when you need a clear, causal answer in situations where attribution is noisy, platforms disagree, or you suspect a channel is driving value outside the clickstream.
Here are a few examples of when and how you would run a Geo experiment.
Scenario: Let’s say an apparel brand uses MMM to guide its media mix. The model shows that Pinterest is one of the most efficient channels, showing a strong revenue return for every dollar spent.
However, the team knows MMM is correlation-based and wants to validate whether Pinterest truly delivers.
Test: They run a GeoLift experiment by pausing Pinterest in a set of randomly selected holdout regions while keeping spend steady in matched test regions. After four weeks, they compare sales between the two to estimate Pinterest’s true incremental ROAS (iROAS).
Takeaway: The holdout comparison shows Pinterest is genuinely incremental, but its real iROAS comes in lower than MMM predicted. That gives the team a causal benchmark to recalibrate MMM and make sharper budget calls.
Scenario: A brand sells skincare products both on their website and on Amazon. They understand how their ads affect site revenue, but they want to quantify whether Google ads also create a halo on their Amazon sales.
Test: They run a GeoLift experiment with Amazon orders as the KPI. Google ads stay on in 60% of regions (treatment) and pause in 40% (holdout). After the test window, they compare Amazon sales between groups to isolate Google’s incremental halo effect.
Takeaway: The results show Google is driving meaningful incremental Amazon revenue. That lifts Google’s true iROAS once omnichannel impact is included, giving the team confidence to scale search.
They also rethink Amazon's performance, recognizing that its efficiency is not solely due to SEO, merchandising, or Prime promotions as previously assumed.
Below are a few ideas of when you could consider running a GeoLift experiment.
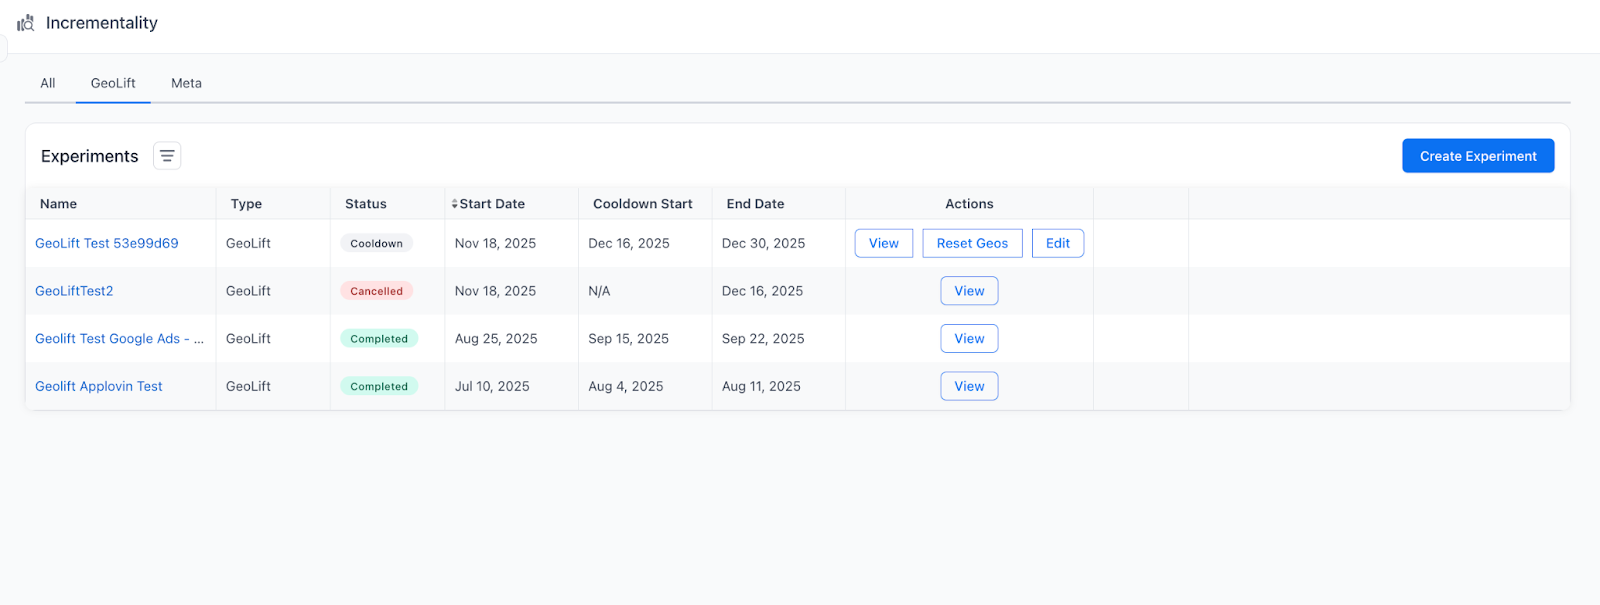
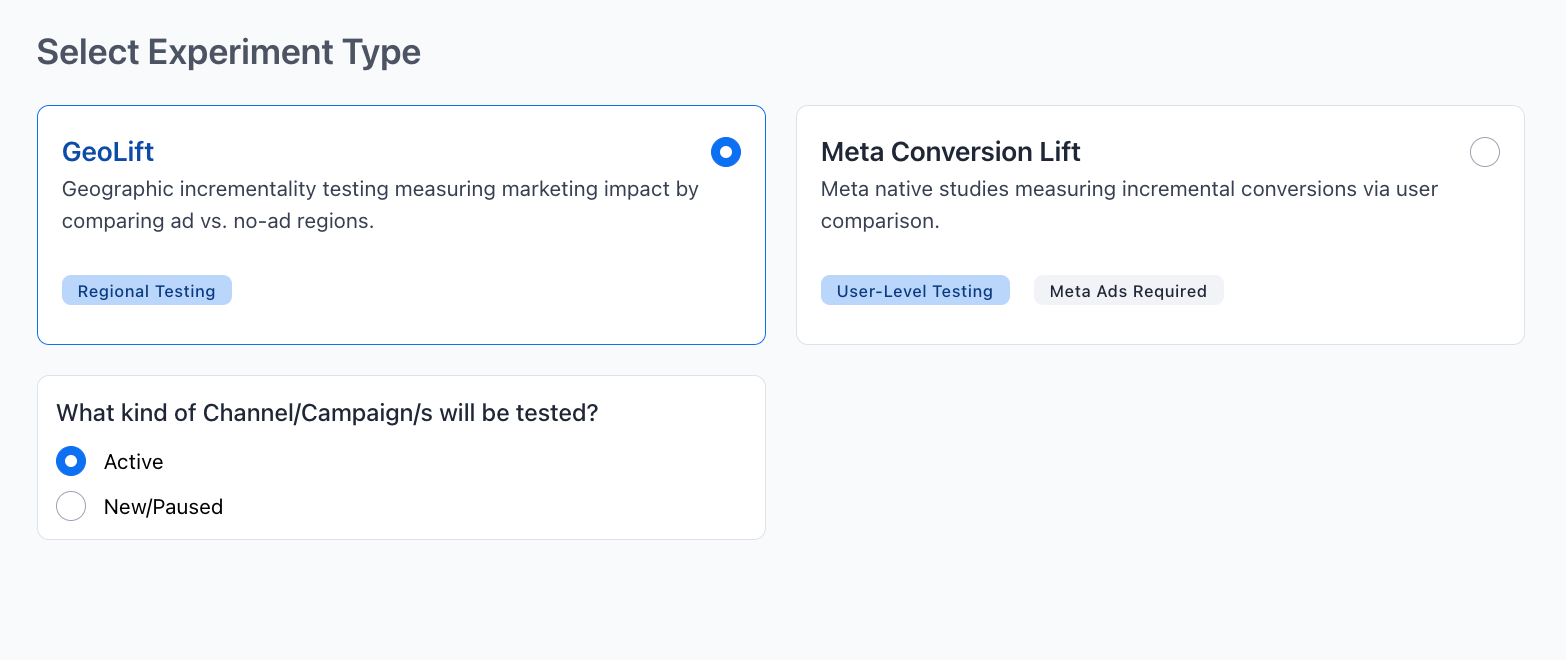
The following is a simple step-by-step guide on how to design a Meta GeoLift test through Triple Whale.
The iROAS input helps GeoLift simulate multiple experiment designs to find the optimal balance between test length, holdout size, and confidence.
Note: The Triple Whale system auto-fills an estimate using session and historical brand data. However, you can include your own estimate if you have a stronger data-driven assumption.
The best practice is to stay realistic. For example, if Meta shows 2.5 ROAS, we suggest entering 2–3 for iROAS, not 10. Learn more about how to calculate ROAS here.
You fill in:
You can click “Generate Recommendations” so you’re never lost on how to run an experiment. GeoLift presents 3 suggested experiment designs, each showing:
A cooldown period is an optional window after the test ends where you keep tracking results to capture delayed conversions.
It’s most useful for longer consideration cycles (like appliances), where ads can influence purchases days or weeks later — in those cases, a 1–2 week cooldown is typical. If your customers usually buy right away, you can skip it.
A strong GeoLift test is mostly about good hygiene: enough time, enough data, and clean, stable markets. Here are the rules that matter most.
Run the test long enough to cover at least one full buying cycle.
The model is only as good as the history you give it.
Pick a design that matches your decision.
DMAs are usually the sweet spot: granular enough for more test cells, but large enough to keep signal stable.
Each measurement method has a place, depending on what you’re trying to learn, how quickly you need an answer, and what data you have. GeoLift is one powerful option in that toolbox, but it works best alongside other approaches rather than replacing them.
Here’s a balanced look at how GeoLift compares to the methods marketers use most often. Need more help? Read how to choose the right attribution model.
Traditional attribution tells you what conversions were associated with ads, not what was caused by ads. It’s great for day-to-day performance management.
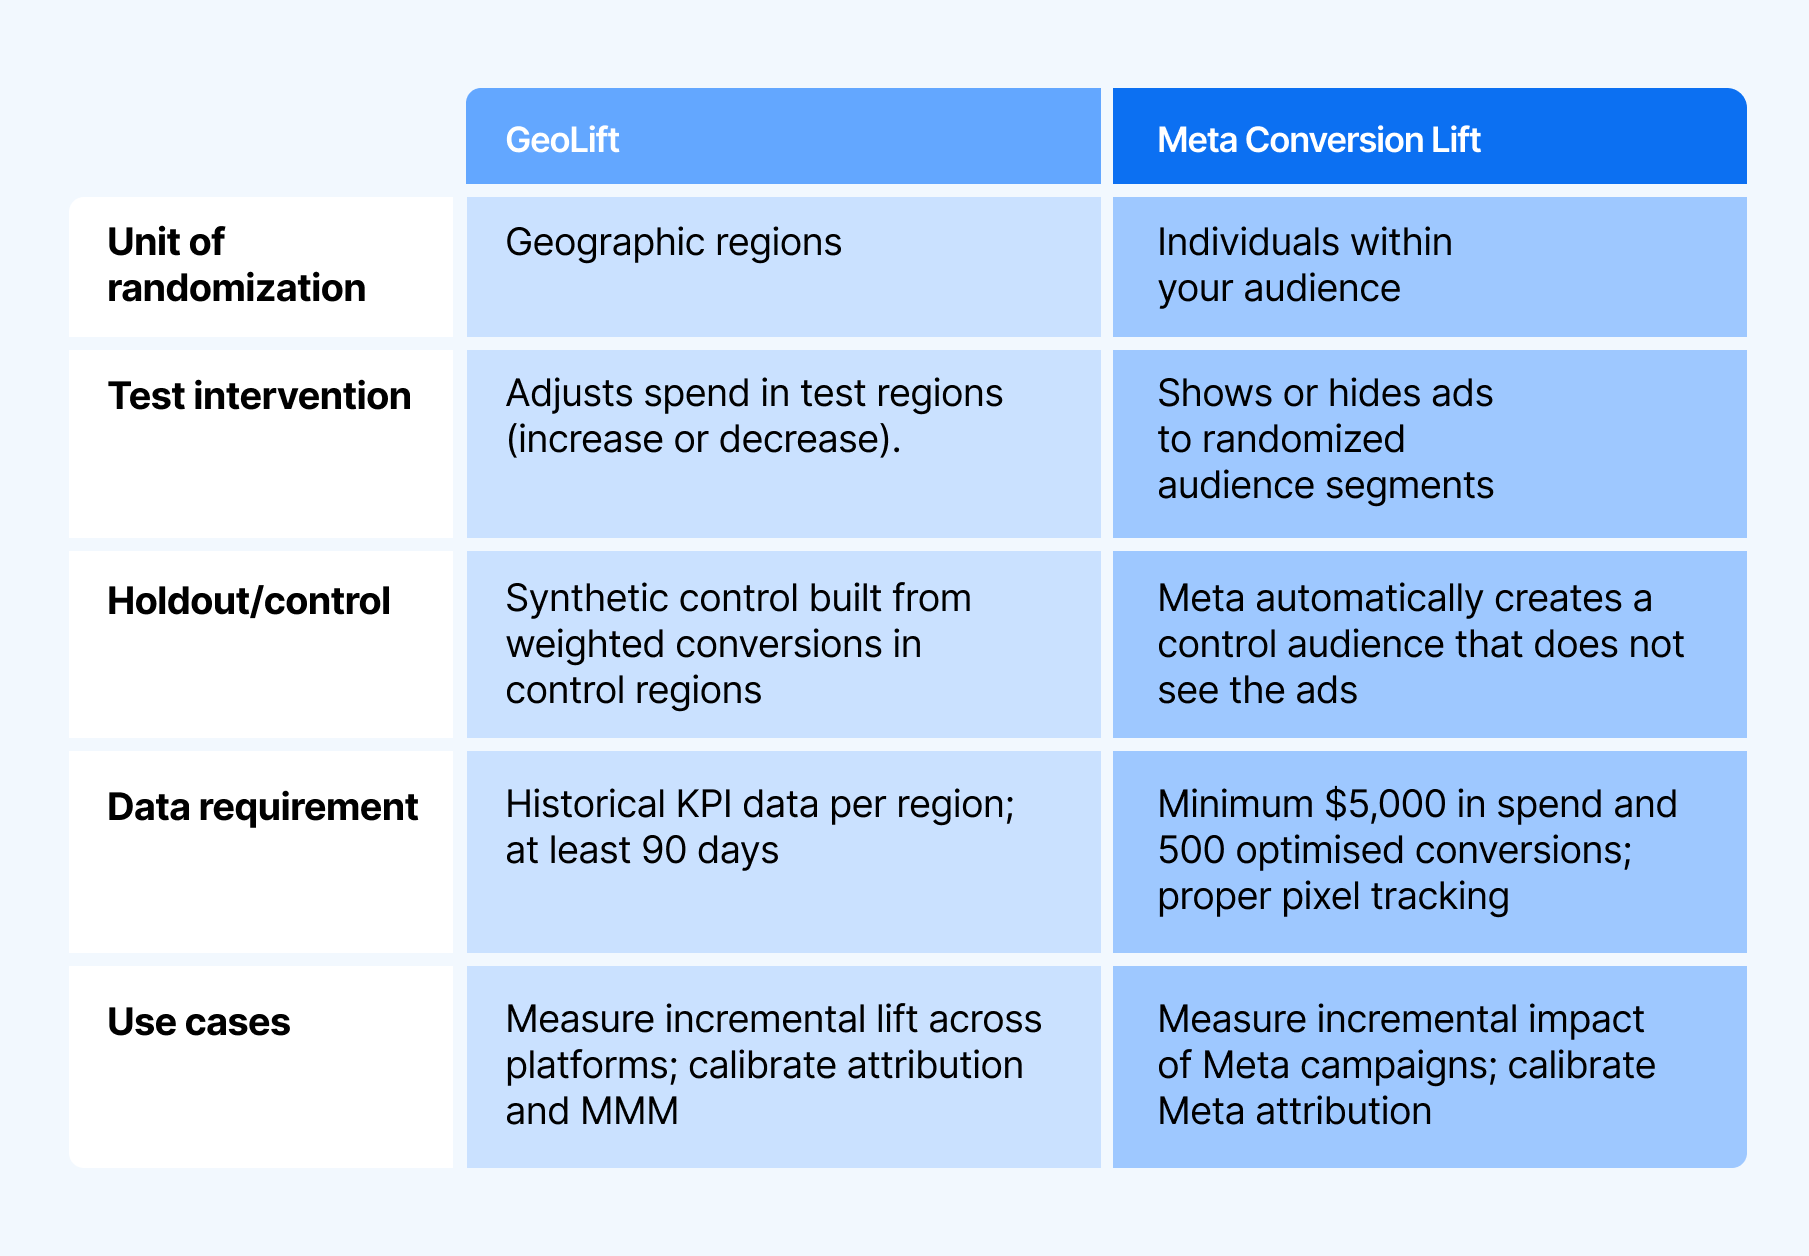
Meta Conversion Lift is a people-based experiment. It measures lift in a similar way — by randomly withholding ads from a group of individuals, then comparing outcomes to those who saw ads.
GeoLift, on the other hand, shifts measurement from tracking people to tracking regions.
Marketing Mix Modeling (MMM) is a correlation-based, top-down model that estimates each channel’s contribution over long time horizons. It’s great for strategic budget planning.
GeoLift complements MMM by providing a causal checkpoint. You can compare GeoLift iROAS to MMM’s predicted efficiency to validate (or recalibrate) the model.
In practice, teams often use GeoLift results as priors or guardrails for MMM so the model stays grounded in real lift.
Multi-Touch Attribution (MTA) assigns credit across touchpoints at the user journey level. MTA is useful for tactical optimization when journey data is strong. It helps answer questions like “which touchpoints are most common before conversion?” and “where should we tune bids or creative?”
But in privacy-constrained environments, it becomes increasingly fragile: missing journeys, modeled conversions, walled-garden gaps, and over-crediting lower-funnel touches.
If you’re making a high-stakes budget call — scaling a channel, cutting spend, or validating a model — Geo testing gives you a market-level truth serum.
If you’re ready to move beyond “directional” and start making budget decisions on proven lift, Compass by Triple Whale makes geo experiments practical, repeatable, and easy to interpret — all inside your unified measurement workflow.
Want to see which attribution or incrementality approach is right for your business? Book a demo today.
Measurement’s gotten a lot messier lately. Privacy changes hide a big chunk of user-level data, last-click misses a ton of upper-funnel value, and platform reports still can’t tell you what ads actually caused lift.
That’s why GeoLift is in the spotlight.
In this guide, you’ll learn what GeoLift experiments are — their benefits, their challenges, examples, and more. So let’s dive straight in.
GeoLift incrementality testing, also known as geo testing or geo-based experiments, helps marketers estimate the true impact of advertising across different regions.
Instead of relying on user-level data, GeoLift measures incrementality at the market level by comparing regions that were exposed to a campaign or spend change against regions that were not.
GeoLift then compares outcomes between those groups to calculate incremental lift — performance attributable to advertising, not to other forces like:
For example, let’s suppose you want to validate whether a new YouTube campaign is truly additive. You run the campaign in 10 treatment designated market areas (DMAs) and exclude 10 closely matched DMAs as controls.
After four to six weeks, GeoLift shows the campaign is generating incremental sales beyond what attribution suggested — giving you a validated, reliable signal to scale your YouTube spend with greater confidence.
Meta GeoLift is an “open source solution from Meta Open Source to calculate lift at a geo-level.” It is not a native Meta product feature.
Meta has published its own geolift documentation and tools for teams who want to run GeoLift experiments using that library directly, typically with support from analysts or data teams.
Triple Whale GeoLift experiments use the same GeoLift-style methodology, but package it into a workflow inside Unified Measurement. With it, you have the power to design and run geo experiments across Meta, Google, YouTube, and other channels.
That said, this guide focuses on running GeoLift through Triple Whale, but the principles apply anywhere you run geo experiments. And as geo-based incrementality testing keeps growing in popularity, understanding GeoLift in any capacity is becoming a must-have skill for modern marketers.
There’s a lot to be said about geo experiments, but here are the four biggest benefits marketers get from GeoLift-style incrementality testing.
With growing blind spots in traditional marketing attribution (zero-click search, social platforms, LLM-driven discovery, and more), GeoLift gives you a way to measure impact without relying on those noisy paths.
It doesn’t need last-click, view-through, or platform-reported conversions — by comparing treatment markets to a matched synthetic control, you observe lift directly in real outcomes.
Because GeoLift measures what changes in a region, it captures the total effect of marketing in that market — including spillover from other channels.
That makes it useful not only for Meta ads, but also for campaigns that run across platforms or even offline media, where cross-channel incrementality is the real question.
GeoLift estimates the delta between what actually happened and what would have happened anyway.
So your lift reflects true incremental sales or conversions, rather than correlation artifacts like organic demand, returning customers, seasonality, or halo effects that attribution often mis-assigns.
GeoLift doesn’t rely on user-level identifiers or personal data, so it stays reliable through privacy shifts like ATT, cookie loss, or future regulation.
As long as you have solid geo-level KPIs and spend data, you can run tests for almost any initiative — across markets, media types, and business models.
Before you think about setup, it helps to understand a few key terms. Once these click, the rest of GeoLift feels much less mysterious. The key ideas are:
GeoLift works by running a controlled experiment across geographic regions like DMAs, states, or zip codes — although, we recommend running them across DMAs (more on that later).
You split markets into two groups:
The more closely these markets match on historical performance and trend, the cleaner the comparison. How you go about matching the markets is considered the “testing environment.”
This synthetic control represents the “what would have happened anyway” baseline. The gap between actual treatment performance and that counterfactual is your incremental lift.
This is a simulation that runs before launch to estimate whether you’re likely to detect lift and how wide your confidence intervals might be. High-confidence designs usually need more time, markets, or a bigger spend change.
Results are typically reported using these terms inside your dashboard:
GeoLift isn’t something you run for every campaign. It’s best when you need a clear, causal answer in situations where attribution is noisy, platforms disagree, or you suspect a channel is driving value outside the clickstream.
Here are a few examples of when and how you would run a Geo experiment.
Scenario: Let’s say an apparel brand uses MMM to guide its media mix. The model shows that Pinterest is one of the most efficient channels, showing a strong revenue return for every dollar spent.
However, the team knows MMM is correlation-based and wants to validate whether Pinterest truly delivers.
Test: They run a GeoLift experiment by pausing Pinterest in a set of randomly selected holdout regions while keeping spend steady in matched test regions. After four weeks, they compare sales between the two to estimate Pinterest’s true incremental ROAS (iROAS).
Takeaway: The holdout comparison shows Pinterest is genuinely incremental, but its real iROAS comes in lower than MMM predicted. That gives the team a causal benchmark to recalibrate MMM and make sharper budget calls.
Scenario: A brand sells skincare products both on their website and on Amazon. They understand how their ads affect site revenue, but they want to quantify whether Google ads also create a halo on their Amazon sales.
Test: They run a GeoLift experiment with Amazon orders as the KPI. Google ads stay on in 60% of regions (treatment) and pause in 40% (holdout). After the test window, they compare Amazon sales between groups to isolate Google’s incremental halo effect.
Takeaway: The results show Google is driving meaningful incremental Amazon revenue. That lifts Google’s true iROAS once omnichannel impact is included, giving the team confidence to scale search.
They also rethink Amazon's performance, recognizing that its efficiency is not solely due to SEO, merchandising, or Prime promotions as previously assumed.
Below are a few ideas of when you could consider running a GeoLift experiment.
The following is a simple step-by-step guide on how to design a Meta GeoLift test through Triple Whale.
The iROAS input helps GeoLift simulate multiple experiment designs to find the optimal balance between test length, holdout size, and confidence.
Note: The Triple Whale system auto-fills an estimate using session and historical brand data. However, you can include your own estimate if you have a stronger data-driven assumption.
The best practice is to stay realistic. For example, if Meta shows 2.5 ROAS, we suggest entering 2–3 for iROAS, not 10. Learn more about how to calculate ROAS here.
You fill in:
You can click “Generate Recommendations” so you’re never lost on how to run an experiment. GeoLift presents 3 suggested experiment designs, each showing:
A cooldown period is an optional window after the test ends where you keep tracking results to capture delayed conversions.
It’s most useful for longer consideration cycles (like appliances), where ads can influence purchases days or weeks later — in those cases, a 1–2 week cooldown is typical. If your customers usually buy right away, you can skip it.
A strong GeoLift test is mostly about good hygiene: enough time, enough data, and clean, stable markets. Here are the rules that matter most.
Run the test long enough to cover at least one full buying cycle.
The model is only as good as the history you give it.
Pick a design that matches your decision.
DMAs are usually the sweet spot: granular enough for more test cells, but large enough to keep signal stable.
Each measurement method has a place, depending on what you’re trying to learn, how quickly you need an answer, and what data you have. GeoLift is one powerful option in that toolbox, but it works best alongside other approaches rather than replacing them.
Here’s a balanced look at how GeoLift compares to the methods marketers use most often. Need more help? Read how to choose the right attribution model.
Traditional attribution tells you what conversions were associated with ads, not what was caused by ads. It’s great for day-to-day performance management.
Meta Conversion Lift is a people-based experiment. It measures lift in a similar way — by randomly withholding ads from a group of individuals, then comparing outcomes to those who saw ads.
GeoLift, on the other hand, shifts measurement from tracking people to tracking regions.
Marketing Mix Modeling (MMM) is a correlation-based, top-down model that estimates each channel’s contribution over long time horizons. It’s great for strategic budget planning.
GeoLift complements MMM by providing a causal checkpoint. You can compare GeoLift iROAS to MMM’s predicted efficiency to validate (or recalibrate) the model.
In practice, teams often use GeoLift results as priors or guardrails for MMM so the model stays grounded in real lift.
Multi-Touch Attribution (MTA) assigns credit across touchpoints at the user journey level. MTA is useful for tactical optimization when journey data is strong. It helps answer questions like “which touchpoints are most common before conversion?” and “where should we tune bids or creative?”
But in privacy-constrained environments, it becomes increasingly fragile: missing journeys, modeled conversions, walled-garden gaps, and over-crediting lower-funnel touches.
If you’re making a high-stakes budget call — scaling a channel, cutting spend, or validating a model — Geo testing gives you a market-level truth serum.
If you’re ready to move beyond “directional” and start making budget decisions on proven lift, Compass by Triple Whale makes geo experiments practical, repeatable, and easy to interpret — all inside your unified measurement workflow.
Want to see which attribution or incrementality approach is right for your business? Book a demo today.


Body Copy: The following benchmarks compare advertising metrics from April 1-17 to the previous period. Considering President Trump first unveiled his tariffs on April 2, the timing corresponds with potential changes in advertising behavior among ecommerce brands (though it isn’t necessarily correlated).


.webp)

.webp)


.png)


.png)
