


In 2018, Uber’s U.S. & Canada Rider Performance Marketing Analytics team suspected that week-over-week CAC fluctuations were driven by seasonality, not Meta ads.
To test this, Uber paused Meta ads for 3 months. They found no measurable business impact. The company reallocated $35M annually from Meta into other channels.
This eye-opening example provides some insights into what incrementality testing is all about. It adds a fresh perspective on the question: “Would I have gotten those sales anyway, without running ads?”
Luckily, you don’t have to totally shut off media to observe impact. This guide breaks down exactly how incrementality works, which methods to use, and everything else you need to know to get started.
Incrementality testing shows the true causal impact of a channel, campaign, ad set, or marketing tactic.
Its job is to isolate media’s effect by controlling for external factors such as seasonality, promotions, or unrelated influences. This ensures that any lift observed is directly attributable to the media being tested, not noise or unrelated influences.
Incrementality testing tools aren't new. In fact, incrementality uses the same principle as used in medical research. In a drug trial, for example, researchers don’t give everyone the medication and observe what happens.
Instead, they create two groups: one that receives the drug and one that doesn’t. By comparing the results between those groups, they can accurately measure how effective the treatment actually is.
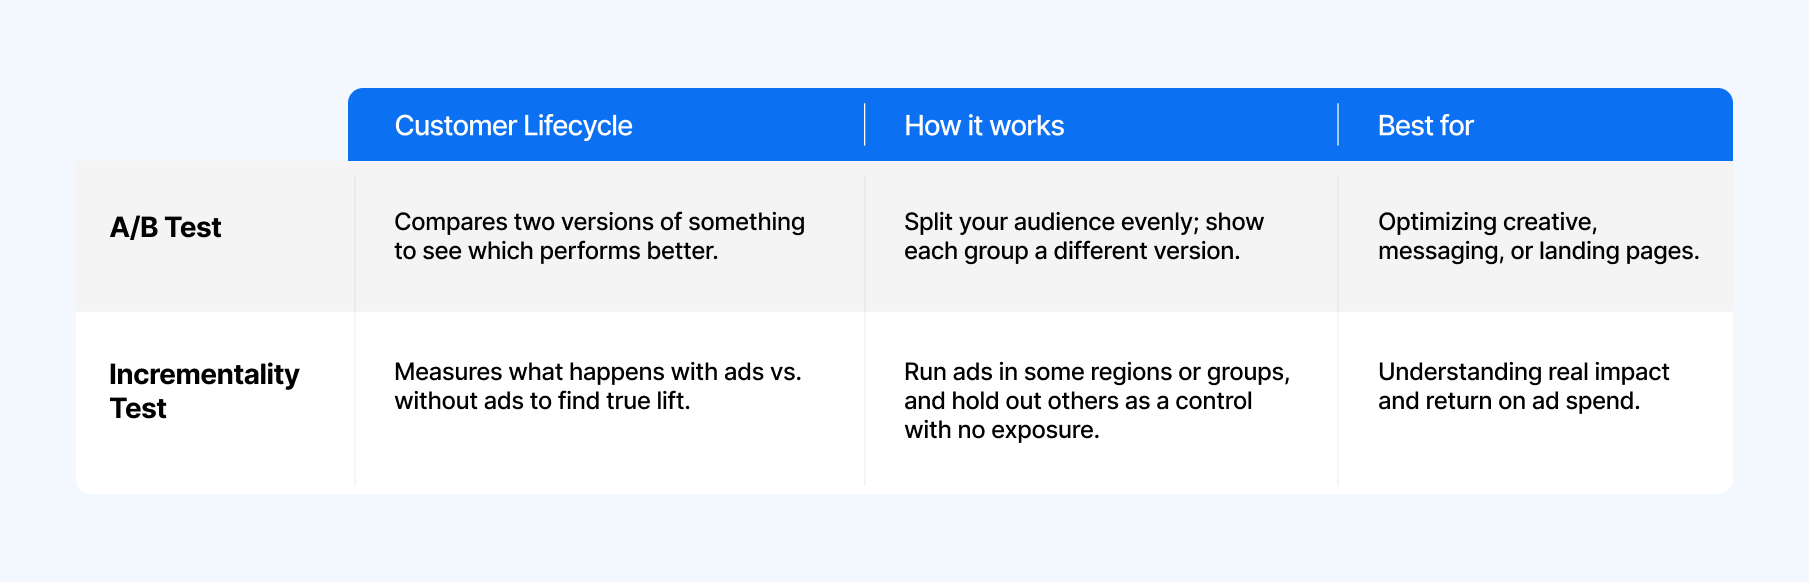
An incrementality test is kind of like an A/B test, but with a twist. Instead of testing two versions of an ad, you’re testing what happens with ads versus without them.
One group sees your campaign as usual, and the other gets nothing. That “no-ad” group acts as your baseline, showing what would’ve happened if you hadn’t run any ads at all.
An A/B test, on the other hand, compares two different versions of something to see which performs better. You might test two ad creatives, two landing pages, or even two subject lines in an email.
Both groups see something. You’re just changing one variable to measure which drives more clicks, conversions, or engagement.
It’s great for optimizing performance within your campaigns, but it doesn’t tell you how much of that performance was truly caused by the campaign itself.
Incrementality is much more complex, so running an incrementality test to compare two creatives inside of an ad set wouldn’t be worthwhile. You could run an incrementality test to see if the entire ad channel themselves is worthwhile, however.
In summary, when it comes to A/B testing versus incrementality: A/B testing is about comparison, while incrementality testing is about causality.
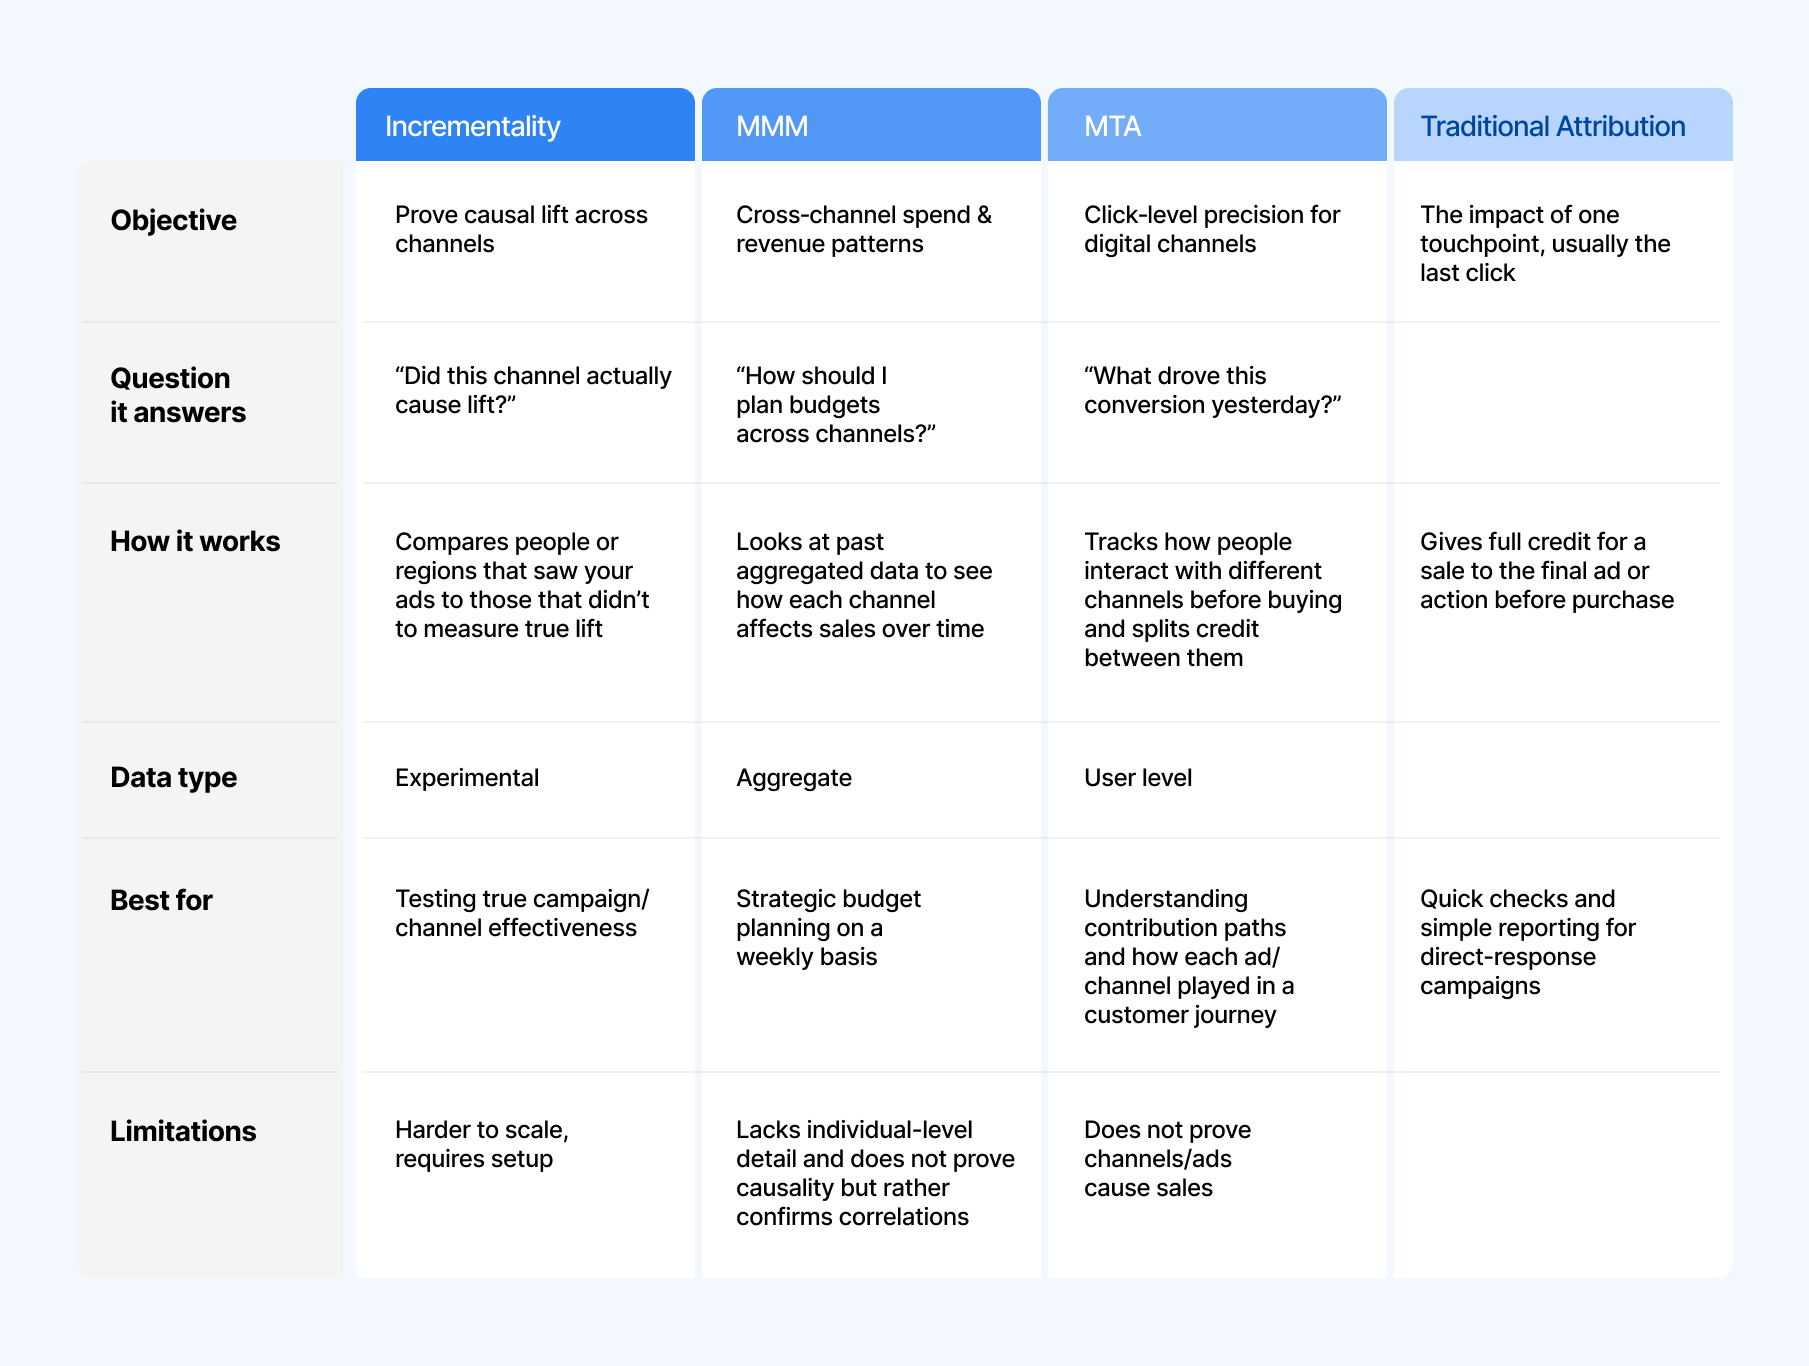
Incrementality testing, media mix modeling, and traditional attribution — how are they different? And what do they have in common?
They each offer distinct lenses for understanding the impact of your marketing efforts. For starters, you plan with MMM, optimize with MTA, and test with incrementality – so let’s dig into it.
Traditional attribution methods track how individual users interact with your ads like which ad they clicked, what channel they came from, and what eventually led to a conversion.
They’re often rule-based (like last-click or first-click) or algorithmic (like data-driven attribution), and they work best when user-level tracking is available.
Some things, like brand search, can look fantastic in a click-based attribution model. When a user searches for a brand and clicks on an ad, it’s easy to attribute the subsequent action to the ad.
In reality, if someone is searching for your brand, they’re expressing an intent and would likely visit your website and make a purchase anyway.
First-click attribution gives full credit to the first interaction a customer has with your brand. It’s good for measuring brand awareness, but doesn’t take into account mid- or low-funnel touchpoints.
Last-click attribution gives full credit to the final touchpoint before a conversion. It’s useful for understanding what closes the sale, but undervalues the rest of the customer journey.
Unlike the aforementioned attribution models that assign credit to a single touchpoint, Multi-Touch Attribution (MTA) takes multiple interactions along the customer journey. It combines first-click, linear, and last-click models to surface which touchpoints actually influence conversions.
However, MTA does not isolate the causal effect of marketing efforts.
Marketing Mix Modeling (MMM) looks at how changes in your marketing activity — like spending more or less on ads week to week — line up with changes in sales.
By spotting those patterns, it estimates how much each channel actually contributes to your results and helps you understand which ones are driving the most impact.
Here’s the thing: MMM requires a large set of historical data to help the model isolate marketing’s true effect. That could mean weeks or months of information on spend, impressions, clicks, and non-marketing factors like seasonality, pricing changes, promotions, weather, or competitor activity.
Incrementality proves causation through lift tests; MMM models correlation across channels.
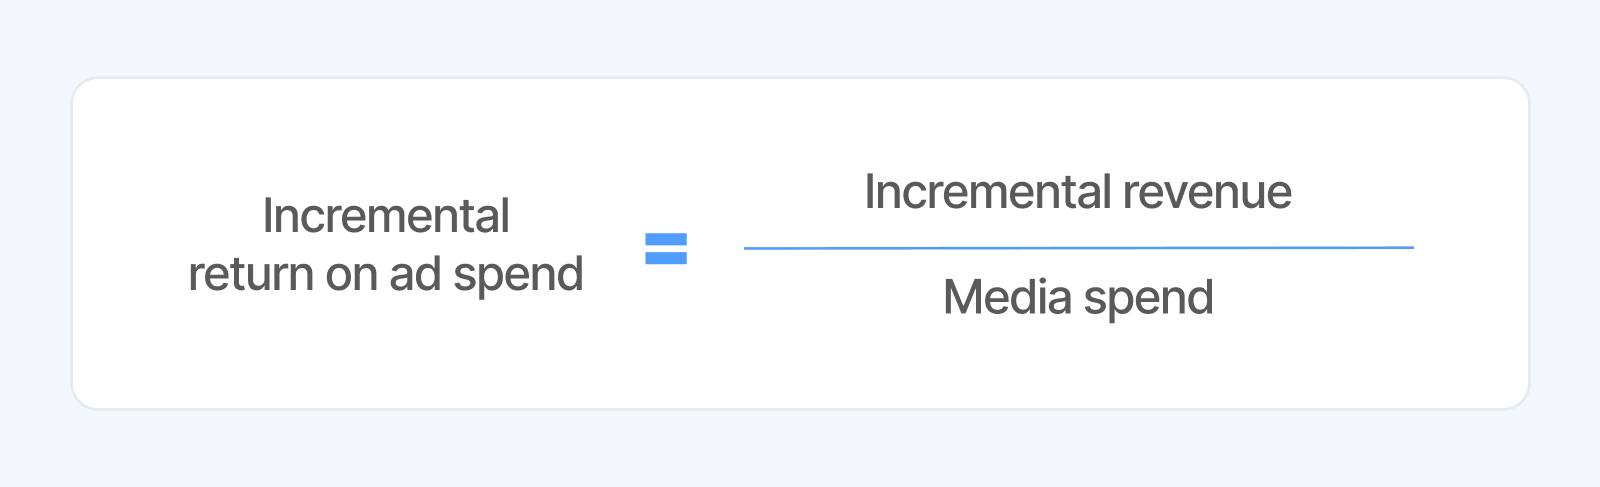
Incrementality is the most accurate way to measure media impact because it’s based on cause and effect, but it does take some upfront planning to get right.
Calculate the conversion difference between the test group and the control group.
Incrementality = (Test Conversion Rate – Control Conversion Rate) / (Test Conversion Rate)
Your test group had a 2% conversion rate, while your control group had a 1% conversion rate.
This suggests that your expected conversion rate would have been 1% without any media exposure.
(2% – 1%) / 2% = 50% incrementality in conversions.
In other words, half of your conversions can be attributed directly to the marketing activity being tested.
Even though there is a fixed calculation, there are various methods you could use to find test incrementality. Below is a general overview of the testing methods.
Conversion lift studies are the most common of the incrementality tests. In this method, you go to an ad platform like Meta or Google and segment users into two groups: a treatment group who sees the ad and a control group who doesn’t see the ad.
Pros: This method is very common and straightforward so it’s easier to get everyone on board and to automate on one platform.
Downside: Due to privacy changes, there’s no certainty that Meta and Google can track the user’s journey. It’s also hard to standardize across platforms, and some platforms restrict access to the test.
In a ghost ad, the ad platform runs an auction for an impression but intentionally withholds the ad from the control group. The system still logs this “ghost” impression, allowing that user to be included in the measurement data.
Ghost bids refer to users who met your campaign’s targeting criteria and were active on the programmatic network, but whose impressions weren’t won in the auction. These users are passively tracked and used to form your control group.
Pros: Both methods are cost-effective and help reduce bias in performance measurement.
Downside: Small or niche audiences can present challenges. These audiences are harder to reach, and competing advertisers may drive up bids for the same users, potentially affecting control group balance and results.
You split people by location instead of user ID — like cities, states, or postal codes. Some locations get ads (treatment), others don’t (control).
Instead of using user-level data, you look at regional trends over time. Then you aggregate sales data from both groups to assess the incremental impact of the ads.
Pros: Privacy-safe and works across online or offline channels.
Downside: Can be expensive and complex to run without analyst support or a partner.
This approach is a bit different. It measures the impact of a marketing change without a designated control group. So, you compare the “before and after” type of change (like we saw with the Uber example above).
For example, you could have a 40% off promotion and measure the sales during the promotional period. Then you measure sales against a similar timeframe.
Pros: Good for small budgets; very simple to do without any intense data needs.
Downside: It’s nowhere near as precise as the other methods as there is no real control group.
Here are the main advantages of incrementality:
There are a few tricks and tips to help you execute your incrementality testing with accuracy, clarity, and confidence. Whether you’re running your first test or refining an existing program, following these best practices will help you generate results you can actually trust.
Your incrementality test depends on context. According to Kellet Atkinson, Director of Product at Triple Whale, “Aim to pull clean performance data into your dashboard, like spend, impressions, conversions, and seasonal factors, so your model understands what’s normal versus caused by marketing.”
Every good test starts with a clear question. Decide what you want to learn—whether it’s measuring incremental lift, validating an attribution model, or seeing if top-of-funnel spend drives new customers.
For example, you might hypothesize that your Google Ads paid search budget for pure brand terms is higher than necessary, and that reducing this spend wouldn’t meaningfully impact net sales. Rather than cutting budget across all advertising regions and simply hoping sales don’t take a major hit, you could run an incrementality test to validate or refute this hypothesis.
Kellet Atkinson adds that “Moby AI can pull unified measurement—combining data from MMM, MTA, and incrementality tests—to give you a weekly action plan. It includes why it’s giving these suggestions and highlights where your data agrees or conflicts, so you know which assumptions to test further.”
For geo-based testing, matched markets are key. These are regions that share similar traits—like demographics and purchasing habits—but aren’t identical. Run your campaign in one (the treatment) and hold it out in a comparable one (the control) to see the true lift from your ads.
Synthetic control goes a step further by statistically blending data from multiple control markets to create a “synthetic twin” of your test region. It’s a more precise comparison—like testing against your market’s digital clone.
Kellet Atkinson notes that Moby AI uses synthetic control to identify the right mix of regions, adjust for spend differences, and ensure results are unbiased.
To make it easier to picture, here are a few examples of how incrementality testing might play out in the real world.
Scenario: Imagine a company identifies a market, let’s say Meta, that appears to be performing well.
Occasionally, they put ad spend into Meta but haven’t seen a strong enough signal to confirm whether investing in this channel will pay off.
To test the hypothesis they run an incrementality test and select a 50% holdout:
Test: This means that for the duration of the test, 50% of their audience won’t see any ads. After the test, we compare results between the population that saw ads and those that didn’t.
The difference in the quantity of revenue between the holdout and treatment group tells us the incrementality of this channel.
Takeaway: In response to this positive result, the customer will likely want to scale up the channel. Afterwards, they should test again at the higher spend level and validate how much to continue scaling up the channel.
Scenario: A company sells through its website and also on Amazon. They have a good sense of the impact of their marketing on direct sales but want to understand the halo effect of their ads on Amazon sales. In particular they wanted to test Google’s halo effect on Amazon sales.
Test: They design a GeoLift experiment with Amazon orders set as the primary KPI. 60% of the country continues running Google ads (treatment), while the remaining 40% pauses Google (holdout).
After the test period, they compare Amazon sales between the two groups to measure the incremental halo effect of Google advertising.
Takeaway: They observe that Google drives a significant amount of incremental Amazon sales. This not only highlights the halo effect of Google advertising but also improves Google’s iROAS when accounting for its omnichannel impact. With this insight, the company can confidently scale Google, knowing it fuels multiple revenue streams.
Conversely, they can maybe reduce Amazon investment, recognizing that its efficiency is not solely due to SEO, merchandising, or Prime promotions as previously assumed.
Incrementality testing is one of the most powerful ways to understand true marketing impact but it does come with a few practical challenges.
Incrementality testing often relies on integrations with ad platforms like Meta, which can introduce setup limitations. Tests may sometimes be delayed or need reconfiguration if the platform doesn’t approve the setup. Alternatively, you can run a Geo test, which allows for more flexibility and control outside of specific ad platform constraints.
Maybe your MMM says to scale, but your platform ROAS doesn’t look right. Maybe your CPA has drifted, but attribution can’t explain why.
This uncertainty is exactly why many teams delay running incrementality tests.
Compass by Triple Whale, our unified measurement system, makes testing a no-brainer.
“You can take the campaign you’re not certain about, and Compass + Moby AI will propose and preconfigure a lift study,” explains Kellet. “All you have to do is dial it in — where you want to test, how fast, how big of a holdout — click one button and it will run it for you. When the test is completed, all the data is in one place.”
Incrementality testing delivers deep causal insights, but it’s most valuable when combined with other measurement models. “If you’re only looking at one tool, it would otherwise be really hard or impossible to see unified insights,” says Kellet Atkinson.
Combining incrementality results with MMM and MTA provides a single, unified view of performance, helping you see how every channel works together to drive real growth.
Incrementality tests help you validate the true incremental impact of your campaigns across every platform, and start optimizing your spend for what really drives growth. But the real power is in combining MMM, MTA, and incrementality.
Ready to test what’s truly working in your marketing? Schedule a demo.
In 2018, Uber’s U.S. & Canada Rider Performance Marketing Analytics team suspected that week-over-week CAC fluctuations were driven by seasonality, not Meta ads.
To test this, Uber paused Meta ads for 3 months. They found no measurable business impact. The company reallocated $35M annually from Meta into other channels.
This eye-opening example provides some insights into what incrementality testing is all about. It adds a fresh perspective on the question: “Would I have gotten those sales anyway, without running ads?”
Luckily, you don’t have to totally shut off media to observe impact. This guide breaks down exactly how incrementality works, which methods to use, and everything else you need to know to get started.
Incrementality testing shows the true causal impact of a channel, campaign, ad set, or marketing tactic.
Its job is to isolate media’s effect by controlling for external factors such as seasonality, promotions, or unrelated influences. This ensures that any lift observed is directly attributable to the media being tested, not noise or unrelated influences.
Incrementality testing tools aren't new. In fact, incrementality uses the same principle as used in medical research. In a drug trial, for example, researchers don’t give everyone the medication and observe what happens.
Instead, they create two groups: one that receives the drug and one that doesn’t. By comparing the results between those groups, they can accurately measure how effective the treatment actually is.
An incrementality test is kind of like an A/B test, but with a twist. Instead of testing two versions of an ad, you’re testing what happens with ads versus without them.
One group sees your campaign as usual, and the other gets nothing. That “no-ad” group acts as your baseline, showing what would’ve happened if you hadn’t run any ads at all.
An A/B test, on the other hand, compares two different versions of something to see which performs better. You might test two ad creatives, two landing pages, or even two subject lines in an email.
Both groups see something. You’re just changing one variable to measure which drives more clicks, conversions, or engagement.
It’s great for optimizing performance within your campaigns, but it doesn’t tell you how much of that performance was truly caused by the campaign itself.
Incrementality is much more complex, so running an incrementality test to compare two creatives inside of an ad set wouldn’t be worthwhile. You could run an incrementality test to see if the entire ad channel themselves is worthwhile, however.
In summary, when it comes to A/B testing versus incrementality: A/B testing is about comparison, while incrementality testing is about causality.
Incrementality testing, media mix modeling, and traditional attribution — how are they different? And what do they have in common?
They each offer distinct lenses for understanding the impact of your marketing efforts. For starters, you plan with MMM, optimize with MTA, and test with incrementality – so let’s dig into it.
Traditional attribution methods track how individual users interact with your ads like which ad they clicked, what channel they came from, and what eventually led to a conversion.
They’re often rule-based (like last-click or first-click) or algorithmic (like data-driven attribution), and they work best when user-level tracking is available.
Some things, like brand search, can look fantastic in a click-based attribution model. When a user searches for a brand and clicks on an ad, it’s easy to attribute the subsequent action to the ad.
In reality, if someone is searching for your brand, they’re expressing an intent and would likely visit your website and make a purchase anyway.
First-click attribution gives full credit to the first interaction a customer has with your brand. It’s good for measuring brand awareness, but doesn’t take into account mid- or low-funnel touchpoints.
Last-click attribution gives full credit to the final touchpoint before a conversion. It’s useful for understanding what closes the sale, but undervalues the rest of the customer journey.
Unlike the aforementioned attribution models that assign credit to a single touchpoint, Multi-Touch Attribution (MTA) takes multiple interactions along the customer journey. It combines first-click, linear, and last-click models to surface which touchpoints actually influence conversions.
However, MTA does not isolate the causal effect of marketing efforts.
Marketing Mix Modeling (MMM) looks at how changes in your marketing activity — like spending more or less on ads week to week — line up with changes in sales.
By spotting those patterns, it estimates how much each channel actually contributes to your results and helps you understand which ones are driving the most impact.
Here’s the thing: MMM requires a large set of historical data to help the model isolate marketing’s true effect. That could mean weeks or months of information on spend, impressions, clicks, and non-marketing factors like seasonality, pricing changes, promotions, weather, or competitor activity.
Incrementality proves causation through lift tests; MMM models correlation across channels.
Incrementality is the most accurate way to measure media impact because it’s based on cause and effect, but it does take some upfront planning to get right.
Calculate the conversion difference between the test group and the control group.
Incrementality = (Test Conversion Rate – Control Conversion Rate) / (Test Conversion Rate)
Your test group had a 2% conversion rate, while your control group had a 1% conversion rate.
This suggests that your expected conversion rate would have been 1% without any media exposure.
(2% – 1%) / 2% = 50% incrementality in conversions.
In other words, half of your conversions can be attributed directly to the marketing activity being tested.
Even though there is a fixed calculation, there are various methods you could use to find test incrementality. Below is a general overview of the testing methods.
Conversion lift studies are the most common of the incrementality tests. In this method, you go to an ad platform like Meta or Google and segment users into two groups: a treatment group who sees the ad and a control group who doesn’t see the ad.
Pros: This method is very common and straightforward so it’s easier to get everyone on board and to automate on one platform.
Downside: Due to privacy changes, there’s no certainty that Meta and Google can track the user’s journey. It’s also hard to standardize across platforms, and some platforms restrict access to the test.
In a ghost ad, the ad platform runs an auction for an impression but intentionally withholds the ad from the control group. The system still logs this “ghost” impression, allowing that user to be included in the measurement data.
Ghost bids refer to users who met your campaign’s targeting criteria and were active on the programmatic network, but whose impressions weren’t won in the auction. These users are passively tracked and used to form your control group.
Pros: Both methods are cost-effective and help reduce bias in performance measurement.
Downside: Small or niche audiences can present challenges. These audiences are harder to reach, and competing advertisers may drive up bids for the same users, potentially affecting control group balance and results.
You split people by location instead of user ID — like cities, states, or postal codes. Some locations get ads (treatment), others don’t (control).
Instead of using user-level data, you look at regional trends over time. Then you aggregate sales data from both groups to assess the incremental impact of the ads.
Pros: Privacy-safe and works across online or offline channels.
Downside: Can be expensive and complex to run without analyst support or a partner.
This approach is a bit different. It measures the impact of a marketing change without a designated control group. So, you compare the “before and after” type of change (like we saw with the Uber example above).
For example, you could have a 40% off promotion and measure the sales during the promotional period. Then you measure sales against a similar timeframe.
Pros: Good for small budgets; very simple to do without any intense data needs.
Downside: It’s nowhere near as precise as the other methods as there is no real control group.
Here are the main advantages of incrementality:
There are a few tricks and tips to help you execute your incrementality testing with accuracy, clarity, and confidence. Whether you’re running your first test or refining an existing program, following these best practices will help you generate results you can actually trust.
Your incrementality test depends on context. According to Kellet Atkinson, Director of Product at Triple Whale, “Aim to pull clean performance data into your dashboard, like spend, impressions, conversions, and seasonal factors, so your model understands what’s normal versus caused by marketing.”
Every good test starts with a clear question. Decide what you want to learn—whether it’s measuring incremental lift, validating an attribution model, or seeing if top-of-funnel spend drives new customers.
For example, you might hypothesize that your Google Ads paid search budget for pure brand terms is higher than necessary, and that reducing this spend wouldn’t meaningfully impact net sales. Rather than cutting budget across all advertising regions and simply hoping sales don’t take a major hit, you could run an incrementality test to validate or refute this hypothesis.
Kellet Atkinson adds that “Moby AI can pull unified measurement—combining data from MMM, MTA, and incrementality tests—to give you a weekly action plan. It includes why it’s giving these suggestions and highlights where your data agrees or conflicts, so you know which assumptions to test further.”
For geo-based testing, matched markets are key. These are regions that share similar traits—like demographics and purchasing habits—but aren’t identical. Run your campaign in one (the treatment) and hold it out in a comparable one (the control) to see the true lift from your ads.
Synthetic control goes a step further by statistically blending data from multiple control markets to create a “synthetic twin” of your test region. It’s a more precise comparison—like testing against your market’s digital clone.
Kellet Atkinson notes that Moby AI uses synthetic control to identify the right mix of regions, adjust for spend differences, and ensure results are unbiased.
To make it easier to picture, here are a few examples of how incrementality testing might play out in the real world.
Scenario: Imagine a company identifies a market, let’s say Meta, that appears to be performing well.
Occasionally, they put ad spend into Meta but haven’t seen a strong enough signal to confirm whether investing in this channel will pay off.
To test the hypothesis they run an incrementality test and select a 50% holdout:
Test: This means that for the duration of the test, 50% of their audience won’t see any ads. After the test, we compare results between the population that saw ads and those that didn’t.
The difference in the quantity of revenue between the holdout and treatment group tells us the incrementality of this channel.
Takeaway: In response to this positive result, the customer will likely want to scale up the channel. Afterwards, they should test again at the higher spend level and validate how much to continue scaling up the channel.
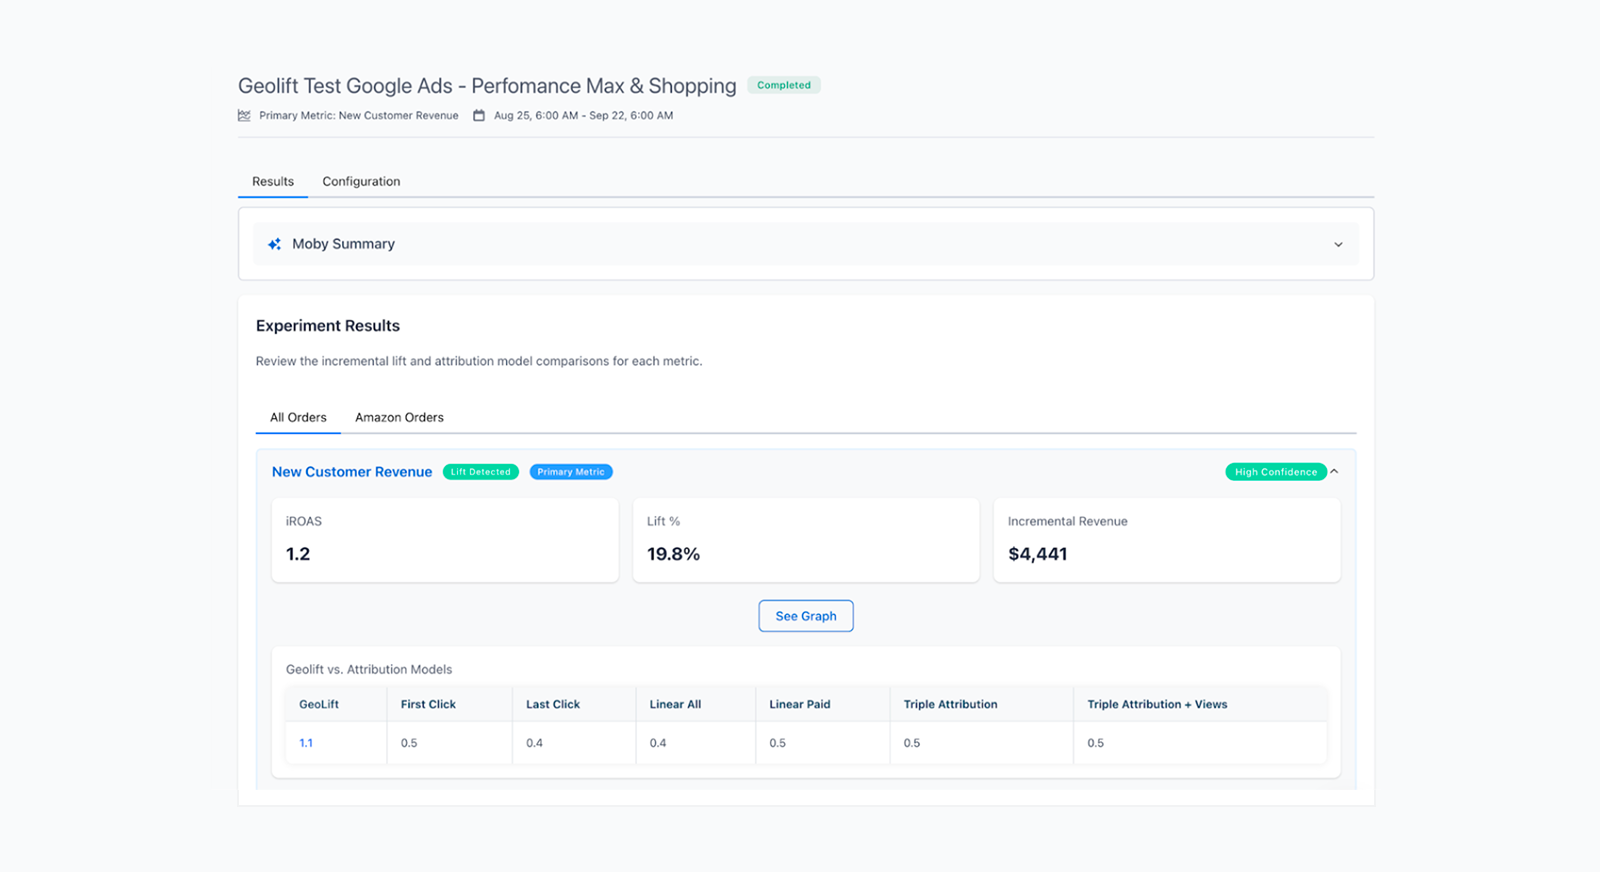
Scenario: A company sells through its website and also on Amazon. They have a good sense of the impact of their marketing on direct sales but want to understand the halo effect of their ads on Amazon sales. In particular they wanted to test Google’s halo effect on Amazon sales.
Test: They design a GeoLift experiment with Amazon orders set as the primary KPI. 60% of the country continues running Google ads (treatment), while the remaining 40% pauses Google (holdout).
After the test period, they compare Amazon sales between the two groups to measure the incremental halo effect of Google advertising.
Takeaway: They observe that Google drives a significant amount of incremental Amazon sales. This not only highlights the halo effect of Google advertising but also improves Google’s iROAS when accounting for its omnichannel impact. With this insight, the company can confidently scale Google, knowing it fuels multiple revenue streams.
Conversely, they can maybe reduce Amazon investment, recognizing that its efficiency is not solely due to SEO, merchandising, or Prime promotions as previously assumed.
Incrementality testing is one of the most powerful ways to understand true marketing impact but it does come with a few practical challenges.
Incrementality testing often relies on integrations with ad platforms like Meta, which can introduce setup limitations. Tests may sometimes be delayed or need reconfiguration if the platform doesn’t approve the setup. Alternatively, you can run a Geo test, which allows for more flexibility and control outside of specific ad platform constraints.
Maybe your MMM says to scale, but your platform ROAS doesn’t look right. Maybe your CPA has drifted, but attribution can’t explain why.
This uncertainty is exactly why many teams delay running incrementality tests.
Compass by Triple Whale, our unified measurement system, makes testing a no-brainer.
“You can take the campaign you’re not certain about, and Compass + Moby AI will propose and preconfigure a lift study,” explains Kellet. “All you have to do is dial it in — where you want to test, how fast, how big of a holdout — click one button and it will run it for you. When the test is completed, all the data is in one place.”
Incrementality testing delivers deep causal insights, but it’s most valuable when combined with other measurement models. “If you’re only looking at one tool, it would otherwise be really hard or impossible to see unified insights,” says Kellet Atkinson.
Combining incrementality results with MMM and MTA provides a single, unified view of performance, helping you see how every channel works together to drive real growth.
Incrementality tests help you validate the true incremental impact of your campaigns across every platform, and start optimizing your spend for what really drives growth. But the real power is in combining MMM, MTA, and incrementality.
Ready to test what’s truly working in your marketing? Schedule a demo.


Body Copy: The following benchmarks compare advertising metrics from April 1-17 to the previous period. Considering President Trump first unveiled his tariffs on April 2, the timing corresponds with potential changes in advertising behavior among ecommerce brands (though it isn’t necessarily correlated).


.webp)

.webp)


.png)


.png)
